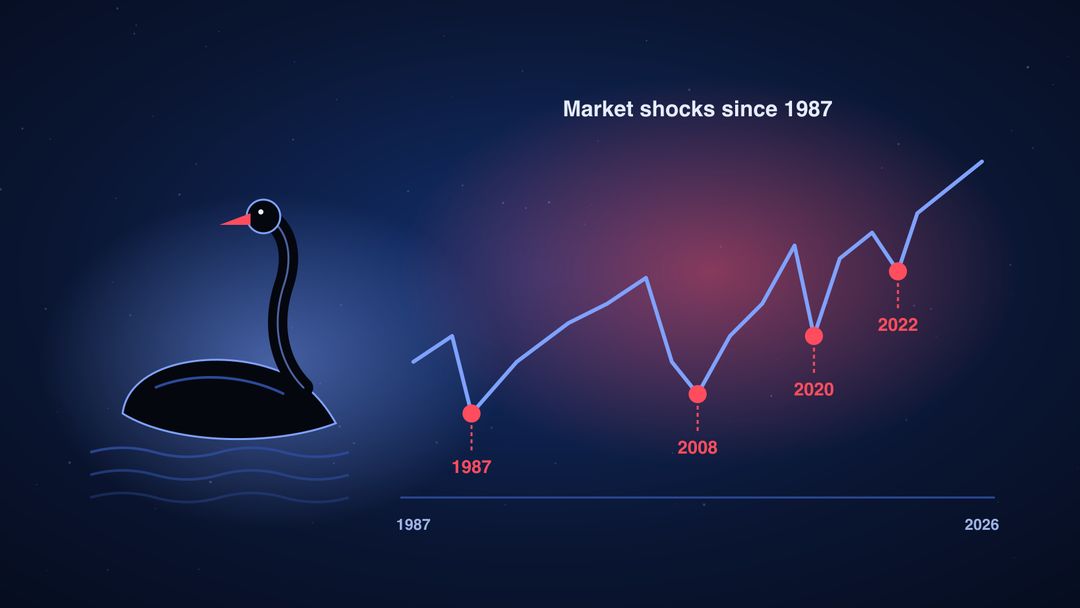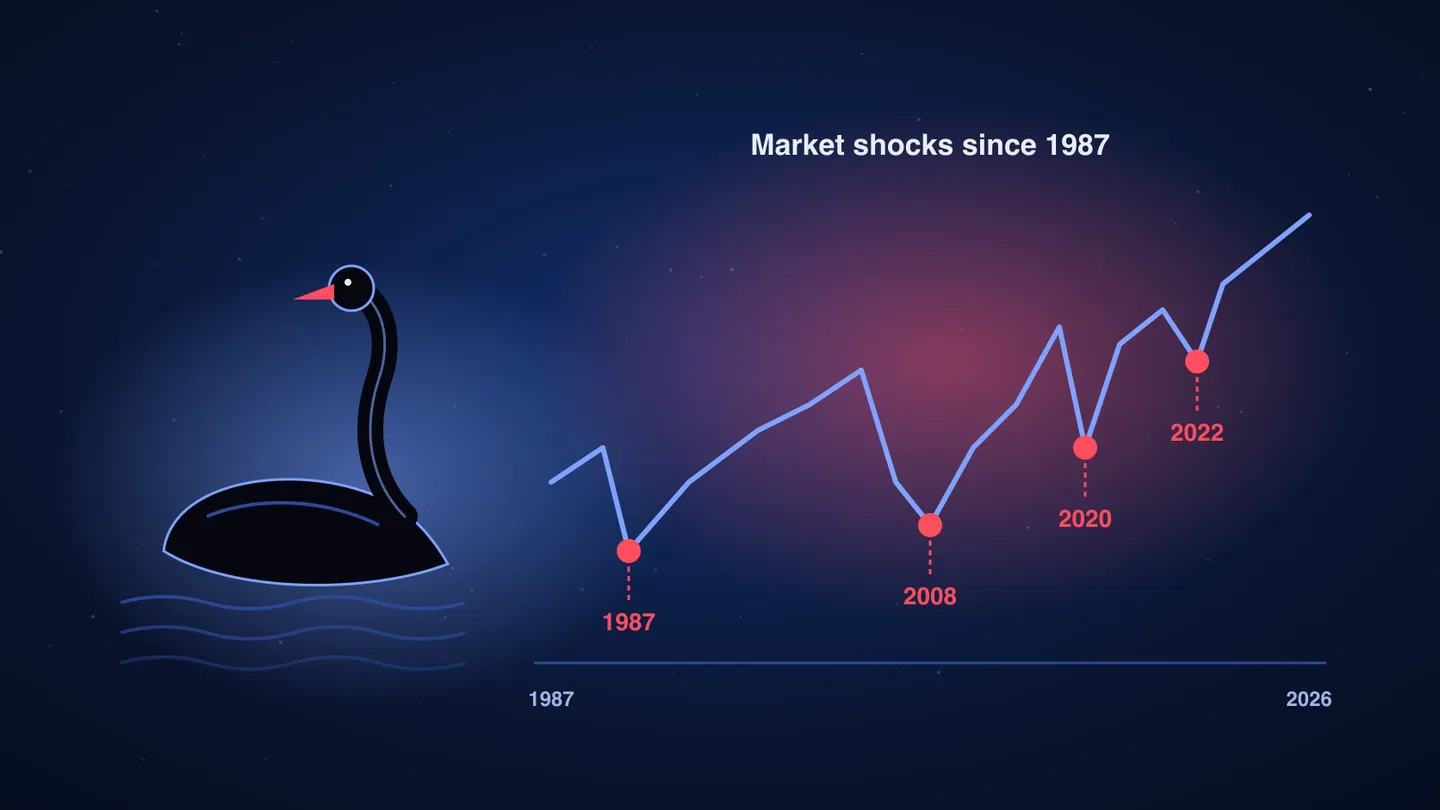
On October 19, 1987, the US stock market lost a fifth of its value in a single day. Nobody had predicted it, and it still holds the record. Since then, markets have been hit again and again by events that “nobody saw coming”: a hedge fund run by Nobel Prize winners, terrorist attacks, a bank that was too big to fail, a virus, an oil price below zero, a crypto exchange worth $32 billion that vanished in a week.
Traders call these black swans. This guide walks through the biggest ones since 1987: how far stocks and Bitcoin fell, how long they took to recover, and what they all have in common. The second half goes deeper, into why standard risk models keep underestimating crashes, and what actually protects a portfolio.
What is a black swan?
For centuries, Europeans believed all swans were white, until black swans were found in Australia. One observation was enough to destroy a “certain” truth.
The trader and author Nassim Nicholas Taleb made the term famous in his 2007 book The Black Swan. A black swan has three features:
- It is rare, far outside what normal experience suggests.
- It has an extreme impact.
- It looks predictable afterwards. Once it happens, everyone explains why it was obvious.
Why we start in 1987
Older crashes exist, most famously 1929, when the Dow Jones fell almost 90% from top to bottom by 1932. But markets back then worked so differently, with no electronic trading, no central bank safety net in the modern sense and few rules, that comparisons are weak. Black Monday in 1987 was the first crash of the modern, computer-driven market, and it opens the era we still live in.
All S&P 500 and Bitcoin figures below are based on daily closing prices.
The black swans, one by one
1987: Black Monday
- What happened: on Monday, October 19, the S&P 500 fell 20.5% and the Dow 22.6%, the largest one-day falls ever. Japan’s Nikkei dropped 14.9% the next day.
- Why: computer programs selling automatically as prices fell (“portfolio insurance”), on top of an expensive, nervous market. Selling triggered more selling.
- Recovery: about two years. The S&P 500 got back above its August 1987 high in July 1989.
- Legacy: “circuit breakers” that pause trading after big falls, and the idea of the Fed stepping in to calm markets.
1998: Russia and Long-Term Capital Management
- What happened: Russia defaulted on its debt in August. Long-Term Capital Management (LTCM), a hedge fund run by star traders and two Nobel Prize-winning economists, had borrowed well over $100 billion on less than $5 billion of its own money. Its bets went wrong all at once.
- Market hit: the S&P 500 fell 19.3% in six weeks.
- Rescue: the New York Fed organized a $3.6 billion bailout by a group of banks, and the Fed cut rates. The market recovered within four months.
- Lesson: models built on past correlations fail exactly when everyone sells at once.
2001: September 11
- What happened: the New York Stock Exchange stayed closed for four trading days after the attacks, its longest closure since 1933.
- Market hit: on reopening, the S&P 500 fell 4.9%, and 11.6% over the week. It was already in a bear market after the dot-com bubble burst.
2008: Lehman Brothers and the financial crisis
- What happened: Lehman Brothers filed for bankruptcy on September 15, the largest bankruptcy in US history. Credit markets froze; banks stopped trusting each other.
- Market hit: the S&P 500 fell 56.8% from its October 2007 peak to March 9, 2009. The VIX “fear index” closed at a record 80.9 in November 2008.
- Recovery: about five and a half years. The 2007 peak was only regained in March 2013.
- Legacy: zero interest rates, quantitative easing and, a few months later, Bitcoin, whose first block mocked the bank bailouts (see our Bitcoin story).
2010: the Flash Crash
- What happened: on May 6, US stocks collapsed in minutes and bounced back almost as fast. The S&P 500 was down 8.6% at the worst point and closed down only 3.2%. Some stocks briefly traded at one cent.
- Why: a huge automated sell order met high-speed traders who pulled back. Liquidity disappeared in seconds.
2015: the Swiss franc shock
- What happened: on January 15, the Swiss National Bank suddenly dropped the cap that had held its currency for three years. The euro fell up to 28% against the franc within minutes.
- Casualties: currency brokers whose clients traded with leverage. One of the largest, FXCM, needed a rescue loan; others went bust. A one-line press release had wiped out years of “safe” trades.
2016: Brexit
- What happened: the UK unexpectedly voted to leave the EU. The pound fell about 8%, to its lowest level since 1985, and the S&P 500 dropped 3.6%.
- Recovery: the S&P 500 recovered in about a month. The pound never fully did.
2018: “Volmageddon”
- What happened: on February 5, the VIX more than doubled in one day, from 17.3 to 37.3, its biggest one-day jump on record.
- Casualties: products that bet on calm markets. A popular note that shorted volatility lost more than 90% in a day and was shut down. The S&P 500 fell 10% in less than two weeks.
- Lesson: “selling insurance” earns a little every day until the day it costs everything.
2020: COVID-19
- What happened: as the pandemic spread, the S&P 500 fell 33.9% in 33 days, the fastest bear market in history. On March 16 it lost 12%, and the VIX closed at an all-time record of 82.7.
- Bitcoin: on March 12, “Black Thursday”, Bitcoin closed 37% lower in a single day, its worst day in our data since 2013.
- Oil: on April 20, the US oil futures price fell to minus $37.63: sellers paid buyers to take oil, because storage was full.
- Recovery: thanks to massive stimulus, very fast. The S&P 500 regained its high in about six months, Bitcoin in about five.
2022: Terra/Luna and FTX
- Terra/Luna (May): the “algorithmic” stablecoin UST lost its dollar peg, and its sister token LUNA went from about $80 to almost zero within days. Tens of billions of dollars disappeared, and the crypto lenders Celsius and Three Arrows Capital collapsed in the following weeks.
- FTX (November): the world’s second-largest crypto exchange went bankrupt in a week after it emerged that customer money had been used elsewhere. Its founder was later sentenced to 25 years in prison. Bitcoin fell to about $15,800 on November 21, the bottom of the cycle.
- Overall: Bitcoin lost 76.6% from its November 2021 high and needed until March 2024 to get back. Meanwhile the S&P 500 fell 25% in 2022, as the fastest rate hikes in 40 years hit everything.
2023: Silicon Valley Bank
- What happened: customers tried to pull out $42 billion in a single day, and on March 10 the bank failed. Signature Bank followed two days later, and First Republic in May.
- Crypto twist: the USDC stablecoin briefly fell to about $0.87, because its issuer had billions of dollars stuck at the bank. Then Bitcoin rallied, as investors questioned the safety of banks. It recovered its pre-crisis level in under a month.
2024: the yen carry trade
- What happened: on August 5, after a surprise rate rise by the Bank of Japan, traders who had borrowed cheap yen to buy other assets rushed to close their positions. Japan’s Nikkei fell 12.4%, its worst day since 1987.
- Elsewhere: the VIX briefly spiked to about 65 in early trading. Bitcoin was down more than 15% during the day.
- Recovery: the S&P 500 regained its high in about two months.
2025: the tariff crash
- What happened: after the US announced sweeping tariffs on April 2, the S&P 500 fell 4.8% and then 6.0% on the next two days, about 10.5% in total. The VIX hit 60.
- The turn: on April 9 a 90-day pause was announced, and the S&P 500 jumped 9.5% in a day, its biggest gain since 2008.
- Recovery: from the February high, the drop reached 18.9%, and the index recovered in about four months.
October 10, 2025: the biggest crypto liquidation ever
- What happened: a threat of 100% US tariffs on Chinese goods hit a market full of borrowed money. About $19 billion of leveraged crypto positions were liquidated, by far the largest amount ever recorded.
- Market hit: Bitcoin fell 14% within the day, and many altcoins crashed far more. Bitcoin’s record close of four days earlier, about $124,750, has not been seen since.
2026: an oil shock and the largest crypto hack ever
- Oil: during the Iran war, US oil prices nearly doubled, from about $58 a barrel at the end of 2025 to $113 on April 7, 2026. Inflation jumped back up and the Fed raised rates in September (see our guide to CPI and the jobs report). The S&P 500 fell 9% between January and March before recovering.
- Binance: on October 29, 2026, North Korean hackers drained about $6.3 billion from Binance’s hot wallets, the largest crypto hack in history. Binance covered every loss and reopened withdrawals within days, but customers pulled out a net $3.6 billion in the first hours. Bitcoin fell 4.3% that day.
It is too early to say how history will judge 2026.
The black swans at a glance
| Event | Date | Market | Fall | Time to recover |
|---|---|---|---|---|
| Black Monday | Oct 1987 | S&P 500 | −33.5% (−20.5% in one day) | ~2 years |
| LTCM and Russia | Aug 1998 | S&P 500 | −19.3% | ~4 months |
| September 11 | Sep 2001 | S&P 500 | −11.6% in a week | Within a longer bear market |
| Lehman Brothers | Sep 2008 | S&P 500 | −56.8% | ~5.5 years |
| Flash Crash | May 2010 | S&P 500 | −8.6% within the day | Minutes |
| Swiss franc | Jan 2015 | EUR/CHF | Up to −28% within the day | Never fully |
| Brexit | Jun 2016 | S&P 500 / pound | −5.6% / −8% | ~1 month / never fully |
| Volmageddon | Feb 2018 | S&P 500 | −10.2% | ~7 months |
| COVID-19 | Mar 2020 | S&P 500 / Bitcoin | −33.9% / −51.9% | ~6 months / ~5.5 months |
| Terra, FTX | 2022 | Bitcoin | −76.6% (whole bear market) | ~2.3 years |
| Silicon Valley Bank | Mar 2023 | Bitcoin | −18.7% | Under a month |
| Yen carry trade | Aug 2024 | Nikkei / S&P 500 | −12.4% in a day / −8.5% | ~2 months (S&P 500) |
| Tariff crash | Apr 2025 | S&P 500 | −18.9% | ~4 months |
| Crypto liquidations | Oct 2025 | Bitcoin | −14% within the day | Not yet |
| Binance hack | Oct 2026 | Bitcoin | −4.3% that day | Too early |
“Fall” is peak to bottom on daily closes unless noted; recovery is the time from the previous peak back to it.
What every black swan has in common
Read the list again and the same ingredients keep appearing:
- Borrowed money. LTCM, the franc brokers, 2008’s banks, the yen carry trade, October 2025. Leverage turns a loss into a forced sale, and forced sales into a crash.
- Crowded trades. Everyone owns the same thing for the same reason, until they all try to leave at once.
- Liquidity disappears. In normal times you can sell easily. In a crash, buyers step back exactly when you need them.
- Everything falls together. Assets that normally move independently suddenly drop as one. Diversification helps least when you need it most.
- The response decides the recovery. When central banks and governments step in hard (1998, 2020), recoveries are quick. When the damage is structural (2008, 2022 crypto), they take years.
Part 2: The advanced view
Fat tails: why the models keep failing
Most risk models assume price changes follow a normal distribution, the familiar bell curve. On that assumption, daily moves far from the average should be almost impossible. Reality disagrees. Over the S&P 500’s 10,292 trading days since 1986, the average daily move was about 1.15%:
| Daily move in the S&P 500 | What a normal model expects | What actually happened |
|---|---|---|
| More than 3% | 93 days | 217 days |
| More than 5% | 0.14 days | 50 days |
| More than 7% | about 0 | 17 days |
| More than 10% | about 0 | 4 days |
Black Monday was a move of almost 18 standard deviations. Under a normal model, that should not happen once in the lifetime of the universe. It happened on an ordinary Monday.
Bitcoin shows the same pattern, only larger. Its average daily move since 2013 is about 3.9%, and it has had 47 days of moves bigger than 15%, where a normal model expects fewer than one.
Markets have fat tails: extreme days are far more common than the textbook says. Any strategy whose risk is measured with a bell curve, such as value at risk or many leveraged “low-volatility” products, underestimates the size of the next crash.
Black swans, grey rhinos and dragon kings
Not every crash is a true black swan:
- Grey rhino (a term coined by Michele Wucker): a big, obvious threat that people ignore, like the US housing bubble before 2008 or overleveraged crypto lenders in 2022. Taleb himself said 2008 was not a black swan to anyone paying attention.
- Dragon king (Didier Sornette): an extreme event produced by a system feeding on itself, such as a bubble that builds up until it must burst. These can sometimes be spotted in advance.
- True black swans are rarer than headlines suggest. The 2015 franc shock and the Flash Crash come close: sudden, with almost no warning.
The practical lesson: much of what gets called “unpredictable” was predictable in kind, if not in timing. You can’t know when, but you can know where the fragility is.
Correlations go to one
In a panic, investors sell what they can, not what they want to. Good assets get sold to cover losses on bad ones. That is why gold, quality stocks and Bitcoin can all fall on the same day. Bonds have often been the exception (they rallied in 2008 and early 2020), but not always: in 2022, stocks and bonds fell together because the shock was inflation itself.
Crypto’s own fragilities
Crypto adds risks the stock market doesn’t have:
- Exchange risk. Mt. Gox in 2014, FTX in 2022, the Binance hack in 2026: the platform holding your coins can fail, even when the coins themselves don’t. Self-custody removes that risk.
- Stablecoin pegs. UST collapsed for good; USDC dropped to $0.87 for a weekend. A “dollar” on a blockchain is only as good as what backs it.
- 24/7 leverage. Crypto trades when stock markets are closed, with very high leverage available, so liquidation cascades like October 2025 can happen at 3 a.m. on a Friday. Our Leverage & Liquidations dashboard shows how much borrowed money is in the market today.
- Hacks. Bridges, exchanges and DeFi protocols are constant targets. Our Crypto Hacks dashboard tracks them.
What actually protects a portfolio
- No (or little) leverage. Almost every account wiped out in these crashes was using borrowed money. Without leverage, a crash hurts but doesn’t force you to sell at the bottom.
- Cash and reserves. Cash is the only asset guaranteed not to fall in a panic, and it lets you buy when others must sell.
- Position sizing. Assume any single position can lose 50–80% overnight, and size it so that you could live with it.
- Diversification, with realistic expectations. It softens most shocks, but not the worst days.
- Tail hedges. Out-of-the-money put options can pay off enormously in a crash (see our options guide), but they cost money every month they aren’t needed. Most investors give up on them right before they would have paid off.
- Time. Every shock in our list was eventually followed by new highs in the S&P 500. The question is whether you can hold on through the recovery, which took two years after 1987 and five and a half after 2008.
The takeaway
Black swans are not as rare as they sound: there has been at least one major shock every few years since 1987, and some years have had several. You can’t predict the next one, but you can predict how it will hurt: through leverage, crowded trades and vanishing liquidity. Build your portfolio so that a crash is something you survive, not something that ends the game.
Prices: S&P 500, Nikkei, VIX, oil and currency daily data from Yahoo Finance; Bitcoin daily closes from CoinMarketCap. Event facts from news reports at the time. This article is for information only and is not financial advice.
Frequently asked questions
What is a black swan event in finance?
A term from trader and author Nassim Taleb: an event that is very rare, has an extreme impact and looks predictable only in hindsight. Market crashes are the classic example.
What was the biggest one-day stock market crash?
Black Monday, October 19, 1987, when the S&P 500 fell 20.5% in a single day. It is still the largest one-day percentage drop in the index's history.
How long does the stock market take to recover from a crash?
It varies widely. After the 2020 COVID crash the S&P 500 recovered in about six months; after 2008 it took about five and a half years to regain its 2007 peak.
How did Bitcoin react to black swan events?
Often harder than stocks. On March 12, 2020, Bitcoin closed 37% lower in one day. After the FTX collapse, it fell to about $15,800, the bottom of that cycle.
Were the 2008 crisis and COVID real black swans?
Debatable. Taleb himself argued that 2008 was predictable, and pandemics had been warned about for years. Many crashes are 'grey rhinos': obvious risks that were ignored.
How can investors protect themselves from black swans?
Avoid leverage, keep cash or reserves, diversify, size positions so a crash can't wipe you out, and keep crypto in self-custody rather than on a single exchange.