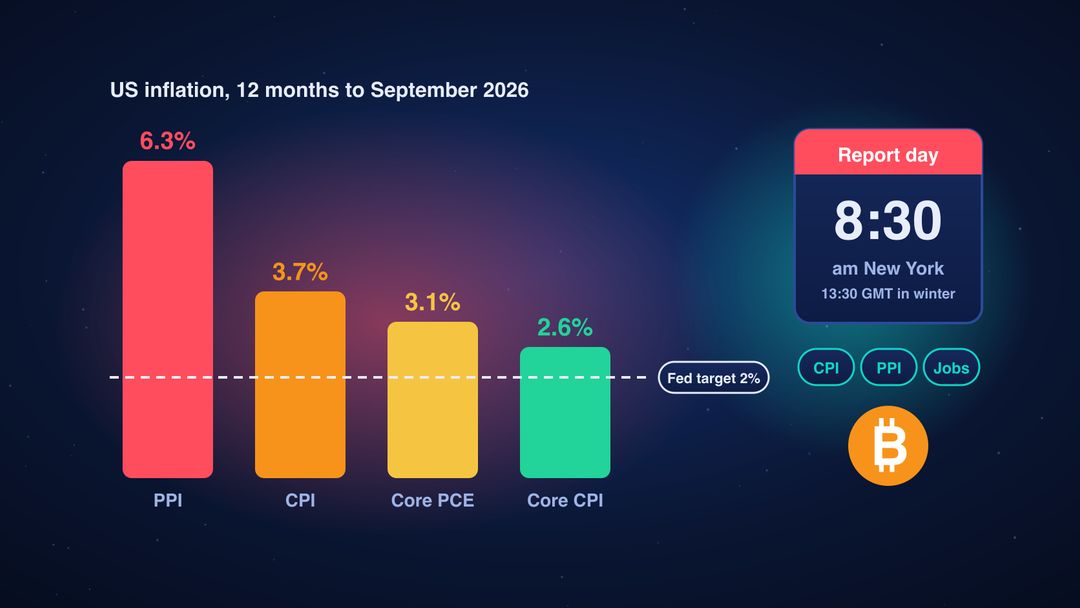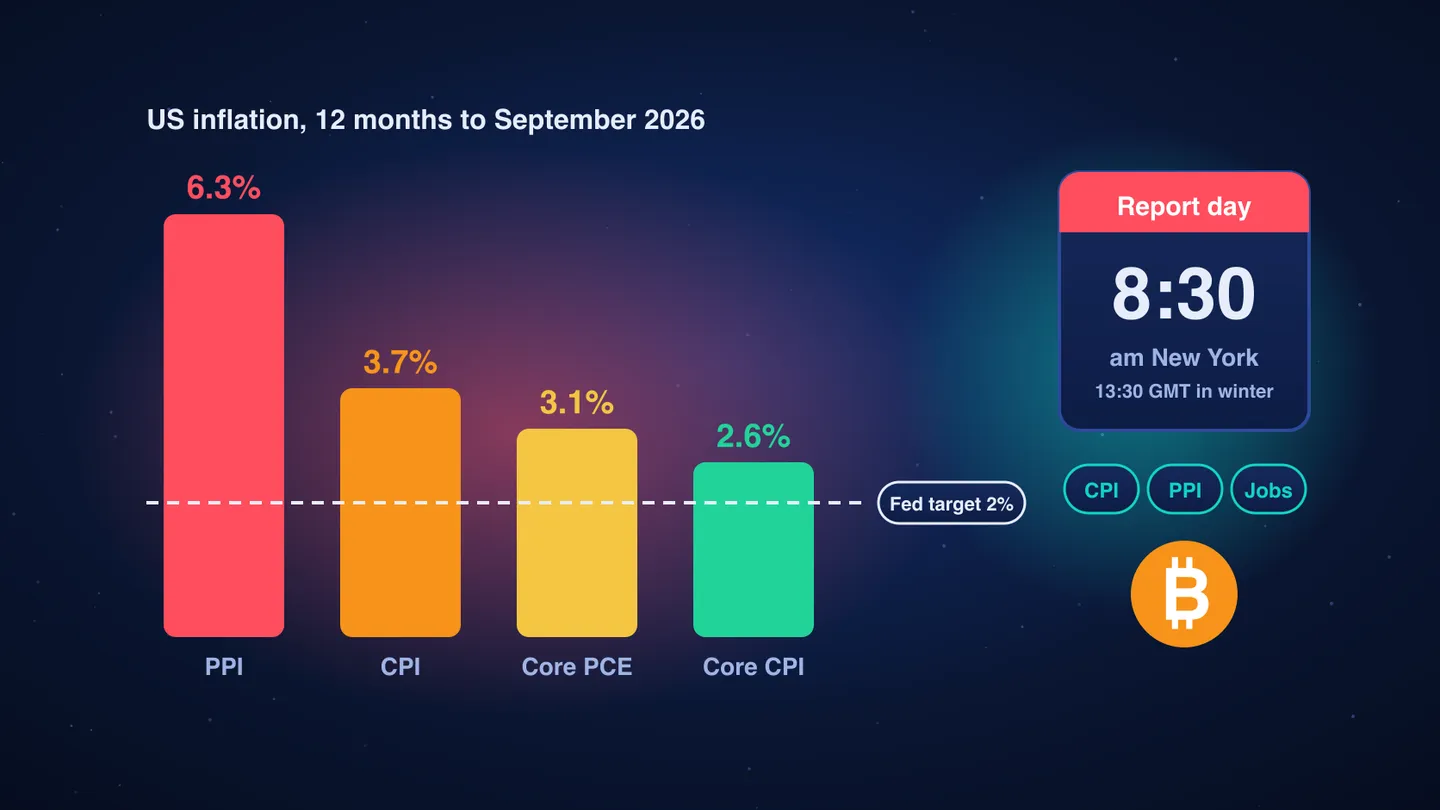
Once a month, at exactly 8:30 am New York time, a few numbers appear on a government website. Within seconds, trillions of dollars of stocks, bonds and currencies reprice, and Bitcoin can swing by thousands of dollars.
Those numbers are the CPI, the PPI and the jobs report. Since inflation came back in 2021, they have been among the most important events on the financial calendar, and in 2026 they matter again. The US has its first interest rate rise since 2023 behind it, and markets are betting on another one.
This guide starts from zero. The first part explains what each report is and why markets care. The second goes deep for readers who want to understand shelter lags, supercore inflation, why core PCE now runs above core CPI, and how to read a jobs report beneath the headline.
All inflation, wage and job figures come from the US Bureau of Labor Statistics (BLS), unless we say otherwise.
Part 1: The basics
Inflation in one paragraph
Inflation is the speed at which prices rise. If a basket of goods cost $100 a year ago and costs $103.70 today, inflation is 3.7%. Prices don’t have to fall for inflation to fall: 3% inflation after 9% inflation still means prices are rising, just more slowly. The US Federal Reserve aims for 2% a year.
CPI: what consumers pay
The Consumer Price Index tracks the prices of a fixed basket of what American households buy: rent, food, gasoline, cars, medical care, phone plans and much more. Each item counts according to how much people spend on it. Housing is by far the largest: shelter is about 36% of the CPI.
You will see two versions:
- Headline CPI: everything.
- Core CPI: everything except food and energy. Those two jump around for reasons such as weather and wars, so core shows the underlying trend better.
Both are quoted two ways: month over month (how much prices rose since last month) and year over year (since the same month last year).
PPI: what producers receive
The Producer Price Index measures prices at the producer level: what factories, farms and service companies receive for what they sell. If a steel maker raises prices, it shows up in PPI first, and may reach consumers later. That is why PPI is often called a pipeline indicator.
PCE: the one the Fed actually targets
The Personal Consumption Expenditures price index comes from a different agency, the Bureau of Economic Analysis, about two weeks after CPI. It gets less media attention, but it is the measure behind the Fed’s 2% target.
The jobs report
Officially called the Employment Situation, it usually comes out on the first Friday of the month. Three numbers matter most:
- Nonfarm payrolls: how many jobs the economy added.
- Unemployment rate: the share of people looking for work who can’t find it.
- Average hourly earnings: how fast pay is rising. Fast wage growth can feed inflation.
The calendar
| Report | What it measures | Published by | Time (New York) | Next date |
|---|---|---|---|---|
| CPI | Consumer prices | BLS | 8:30 am | Nov 10, 2026 |
| PPI | Producer prices | BLS | 8:30 am | Nov 13, 2026 |
| Jobs report | Jobs, unemployment, pay | BLS | 8:30 am | Dec 4, 2026 |
| Fed decision | Interest rates | Federal Reserve | 2:00 pm | Dec 9, 2026 |
8:30 am in New York is 13:30 GMT in winter and 12:30 GMT in summer. Our Macro Calendar dashboard shows a countdown to each report.
Why markets care so much
The Fed has two jobs: stable prices and maximum employment. Its main tool is the interest rate.
- Inflation too high → the Fed raises rates or keeps them high → borrowing costs more → stocks, Bitcoin and other risky assets usually suffer.
- Inflation falling or jobs weakening → the Fed can cut rates → money gets cheaper → risky assets usually benefit.
So these reports are really a monthly vote on what the Fed will do next.
The golden rule: only the surprise matters
Before each report, economists publish forecasts, and traders position around them. The expected number is already in the price. Markets move on the gap between the forecast and the result.
Two days in 2022 show how powerful that is:
| Date | Report | Forecast | Actual | S&P 500 that day |
|---|---|---|---|---|
| Sep 13, 2022 | August CPI | 8.1% | 8.3% | −4.3% (worst day since June 2020) |
| Nov 10, 2022 | October CPI | 7.9–8.0% | 7.7% | +5.5% |
Inflation of 7.7% was terrible by any normal standard, and the market had one of its best days of the decade, because it was a little less terrible than feared.
When good news is bad news
In a healthy economy, more jobs are good news. But when the Fed is fighting inflation, a strong job market can mean higher rates for longer. Markets may fall on good economic data.
November 6, 2026 is a live example. The US added 165,000 jobs in October, against about 65,000 forecast. Bets on a December rate rise jumped to about 78%, according to Reuters, the 2-year Treasury yield rose to about 4.52%, and the dollar gained. Our news report has the details.
Why Bitcoin reacts
Bitcoin doesn’t have earnings or a central bank, yet it reacts to all of this. Interest rates decide how attractive a risky asset without yield is, compared with a safe bond paying over 4%. A stronger dollar and tighter money also tend to work against crypto.
Crypto has one more feature: it trades at 8:30 am, when the New York stock exchange is still closed. Leveraged traders can get wiped out in seconds, which can make the first move bigger than the news deserves. Our Macro Calendar dashboard lists how Bitcoin reacted to every report since 2019.
Where inflation stands now
| 12-month change | Jun 2022 | Dec 2025 | Sep 2026 |
|---|---|---|---|
| CPI (headline) | 9.1% | 2.7% | 3.7% |
| Core CPI | 5.9% | 2.6% | 2.6% |
| Energy | 41.6% | 2.3% | 20.4% |
| Shelter | 5.6% | 3.2% | 3.2% |
| PPI (final demand) | 11.2% | 3.1% | 6.3% |
| Average hourly earnings | 5.4% | 3.7% | 3.2% |
Headline CPI peaked at 9.1% in June 2022, the highest in about 40 years, and fell to 2.3% by April 2025. The job looked nearly done. In 2026 it reversed: energy prices surged during the Iran war, gasoline rose 9.1% in September alone and 34.2% over the year, and the Fed raised rates in September, its first increase since 2023.
Notice one thing in the table: wages rose 3.2% while prices rose 3.7%. Workers’ real pay is falling, which is exactly how an energy shock hurts households.
Part 2: Reading the data like a professional
12 months hides the turning points
The year-over-year rate is an average of the last 12 monthly changes. It moves slowly, and it is also affected by base effects: a large rise a year ago drops out of the calculation, so inflation can “fall” without anything improving today.
Professionals annualize the last three months instead. For core CPI in 2026, the 12-month rate looks calm at 2.6%, but the three-month annualized pace rose from 1.6% in July to 3.4% in September, after three monthly rises of 0.22%, 0.29% and 0.33%. That is the number that should worry the Fed, not the 2.6%.
The headline shows how noisy these rates can be. Three-month annualized CPI went from 0.2% in August to 4.6% in September, on a single jump in gasoline.
The energy question: look through it, or not?
Central banks are taught to look through supply shocks. Higher rates can’t produce more oil. If energy prices rise and then stop, the 12-month rate falls by itself a year later.
The danger is second-round effects: energy moves into airline fares, shipping and food, workers ask for higher pay, and people start to expect more inflation. That is the real debate inside the Fed today. PPI, up 5.0% even without food, energy and trade margins, suggests that the costs are spreading through the pipeline. Two officials voted for another hike in October.
Shelter: the giant that lags
Shelter is 35.6% of CPI, and owners’ equivalent rent (OER), about 25.2%, is the largest single item. OER is an estimate of what homeowners would pay to rent their own home; nobody actually pays it.
It is also slow. BLS samples rents on existing leases, which reset only about once a year, so changes in market rents take many months to appear. In the last cycle, headline CPI peaked in June 2022, but shelter inflation kept climbing to 8.2% in March 2023, nine months later. That kept CPI high long after new-lease rents had cooled, so traders learned to watch private rent indexes as a leading signal. Today shelter runs at 3.2%, close to its level before the pandemic (3.2% in December 2019).
Core goods and supercore
Split core CPI into three pieces, and each tells a different story:
| Piece | Sep 2026 | Peak since 2021 | What drives it |
|---|---|---|---|
| Core goods | 0.7% | 12.3% (Feb 2022) | Supply chains, tariffs, the dollar |
| Shelter | 3.2% | 8.2% (Mar 2023) | Rents, with a long lag |
| Services less rent of shelter | 3.2% | 8.2% (Sep 2022) | Mostly wages |
The third piece is close to what traders call supercore. Former Fed chair Jerome Powell made it famous in 2022 as the part most closely tied to the labor market. (Definitions vary. Some exclude energy services too, and the Fed’s version uses PCE.) At 3.2% it is still well above what a 2% target needs, and its three-month pace rose to 3.3% in September.
Why core PCE is above core CPI
For most of history, PCE inflation runs below CPI. In September 2026 it is the reverse: core PCE 3.1%, core CPI 2.6%. Two mechanics are behind differences like this one:
- Weights. PCE covers all consumption on behalf of households, including what employers and government pay for health care. Housing therefore has a far smaller weight than in CPI. When shelter is cooling, as now, it pulls CPI down more than PCE.
- Sources. Several PCE items are priced with PPI data, not CPI: airfares, some medical services and, notably, portfolio management fees, which rise automatically when stock prices rise. That is why professionals build a PCE forecast right after the PPI release, and why the PPI can move bond markets even when no one cares about the headline.
PCE also uses a formula that adjusts the basket as people switch to cheaper goods, while CPI’s basket changes more slowly.
The practical lesson: core CPI at 2.6% makes inflation look almost solved. The measure the Fed actually targets says otherwise.
PPI is not a crystal ball
“Producer prices today, consumer prices tomorrow” is too simple. In 2022, PPI peaked at 11.7% in March, three months before CPI, which fits the story. But PPI is heavy in commodities, so it swings far more than CPI, and companies can absorb costs in their margins instead of passing them on. Focus on final demand less foods, energy and trade services, and on the components that feed PCE, rather than the headline.
Seasonal adjustment and a missing month
Monthly changes are seasonally adjusted; the 12-month rate is not. That explains why the same gasoline index rose 9.1% in the adjusted data and 6.5% in the raw data in September: the adjustment expects prices to fall at that time of year. Adjustment factors are revised every February, and they can flatter or distort early-year readings.
One more trap for the next report: the 2025 government shutdown left no CPI for October 2025. So the October 2026 report, due on November 10, has no normal month to compare with. Read how BLS presents the 12-month change before reacting to it.
Reading the jobs report beneath the headline
- Two surveys. Payrolls come from a survey of employers; the unemployment rate comes from a survey of households. They can disagree for months.
- Revisions. Today’s report revised September from 29,000 to 60,000 jobs. A “miss” can vanish a month later, and annual benchmark revisions can be much larger. Always read the three-month average.
- The breakeven rate. A strong number is relative. In 2022 the economy added about 377,000 jobs a month; today, with slower labor force growth, far lower numbers keep unemployment stable. That is how an unemployment rate of 4.1% can sit next to weak hiring.
- Participation. At 61.9% it is still below the 63.3% of February 2020. A falling unemployment rate means less if people are leaving the labor force.
- Wages. Average hourly earnings are skewed by which sectors are hiring. The Fed prefers the quarterly Employment Cost Index, which controls for that.
- Part-time work. In today’s report, people working part time for economic reasons rose by 339,000. Strong headlines can hide weaker details.
JOLTS gives a slower but revealing view. Job openings fell from a record 12.3 million in March 2022 to 7.5 million in September 2026, and the quit rate fell from 3.0% to 2.1%. People quit when they are confident of finding something better, so quits are one of the best signals of wage pressure.
The Sahm rule: a warning that needs context
The Sahm rule signals a recession when the three-month average unemployment rate rises 0.5 points above its low of the past 12 months. On BLS data it triggered in July 2024, and markets panicked in early August of that year, helped by a shock in the Japanese yen. No recession followed. Unemployment was rising partly because more people were looking for work, not only because of layoffs. It reads 0.0 today. A rule built on past recessions doesn’t always understand a new kind of labor market.
From the data to the price: the rate path
Traders don’t really trade the CPI. They trade what it does to the expected path of interest rates.
- The front end first. The 2-year Treasury yield is the cleanest read on Fed expectations.
- Fed funds futures turn each surprise into a probability, as with the 78% for December.
- Real yields (Treasury yields minus expected inflation) are the true cost of money, and they matter most for long-duration assets such as growth stocks and Bitcoin.
- The curve. If the 10-year rises because of stronger growth, risk assets can cope. If it rises because investors demand more to lend to a government with $40 trillion of debt, they usually can’t.
- Positioning. A hot number hits harder when traders are crowded the other way. Funding rates and open interest on our Leverage & Liquidations dashboard show when crypto is crowded.
- Volatility pricing. Option premiums rise into a big report and collapse right after, the “IV crush”. Being right on direction can still lose money.
The market’s reaction function changes
The same number can mean opposite things in different regimes:
| Regime | Fed’s main worry | Hot data | Weak jobs |
|---|---|---|---|
| Inflation fight (2022) | Prices | Very bad | Good: fewer hikes |
| Soft landing (2024) | Jobs | Mild | Bad: recession fear |
| Stagflation risk (2026) | Prices, with weak hiring | Very bad | Mixed: no easy answer |
Before you trade a release, ask what the market is afraid of this month. In 2026 the worst mix for investors is high inflation with a weak job market, because the Fed can’t help both.
A checklist for report day
- Know the forecast, for headline and core, month over month and year over year.
- Check the monthly core number first. It is usually what the market trades in the first seconds.
- Then the details: shelter, supercore, energy pass-through, and revisions to earlier months.
- Watch the 2-year yield and the dollar. They tell you how the market reads the data.
- Don’t chase the first candle. Algorithms move first, and the first move often reverses.
- Lower your leverage before the release. Spreads widen and stops slip in the first minute.
The takeaway
For beginners, one idea covers most of it: these reports matter because they decide what the Fed does with interest rates, and markets react to the surprise, not the number.
For advanced readers, the story of 2026 sits under the headlines. Core CPI at 2.6% looks almost normal. But the three-month pace is rising, core PCE is at 3.1%, core PPI is at 5.0%, and energy is spreading through the pipeline, while real wages are falling and hiring is weak. That is why the next CPI report, on November 10, may matter more than any since 2022.
Data: US Bureau of Labor Statistics (public domain), through September 2026 for prices and October 2026 for jobs and earnings. PCE figures as reported from the Bureau of Economic Analysis’s October 29 release. This article is for information only and is not financial advice.
Frequently asked questions
What is the difference between CPI and PPI?
CPI measures the prices consumers pay. PPI measures the prices producers receive for what they sell. Both come from the US Bureau of Labor Statistics every month.
What is core inflation?
Core inflation removes food and energy, whose prices jump around. In September 2026, headline CPI was 3.7% over 12 months, while core CPI was 2.6%.
Which inflation measure does the Fed target?
The Fed's 2% target refers to the PCE price index, not CPI. In September 2026, PCE rose 3.6% over 12 months and core PCE rose 3.1%.
Why do markets care about CPI and the jobs report?
They shape what the Federal Reserve does with interest rates. Markets react to the surprise against forecasts, because expected numbers are already in the price.
What time are CPI, PPI and the jobs report released?
All three come out at 8:30 am New York time, which is 13:30 GMT in winter and 12:30 GMT in summer.
Why can good jobs news be bad for stocks?
When the Fed is fighting inflation, a strong job market makes higher interest rates more likely. Higher rates make stocks and Bitcoin less attractive.
What is supercore inflation?
Supercore usually means services prices without housing rents, a measure closely linked to wages. In September 2026, services less rent of shelter rose 3.2% over 12 months.