Price action dashboards
How crypto prices behave: Bitcoin around the New York stock market open, the usual months and weekdays, where Bitcoin is in its four-year cycle, and market cap peaks.
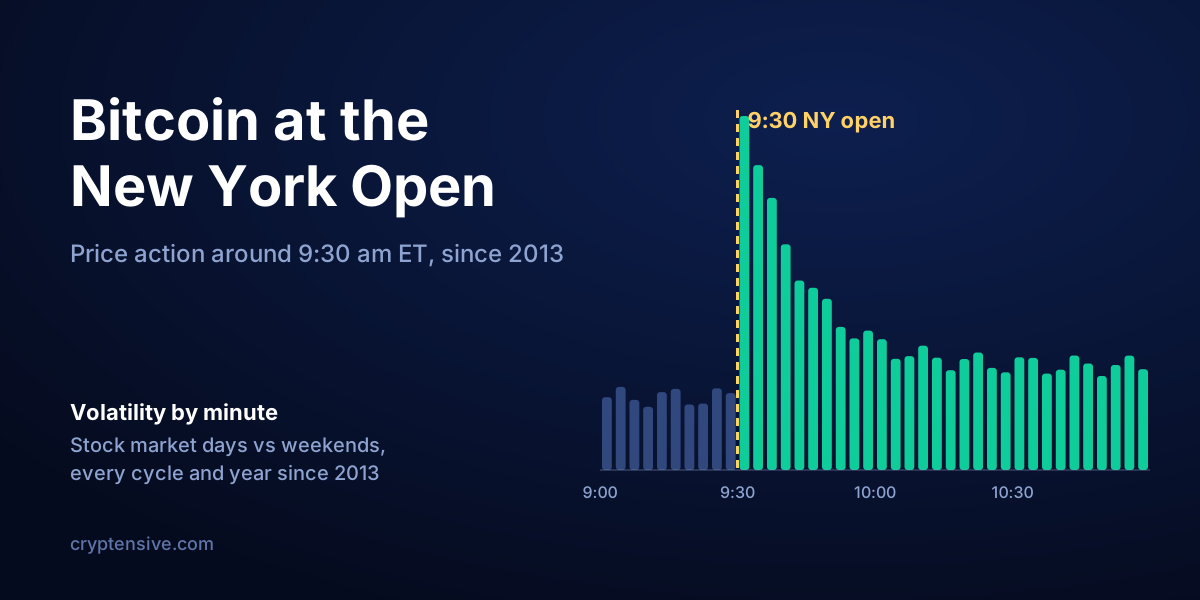
Bitcoin at the New York Open
What Bitcoin does when the US stock market opens at 9:30 am ET: prices at 9:29, 10:00, 10:30 and 13:30 every trading day since 2013, the average path, volatility by minute, event days, and filters by cycle and year.
Open dashboard →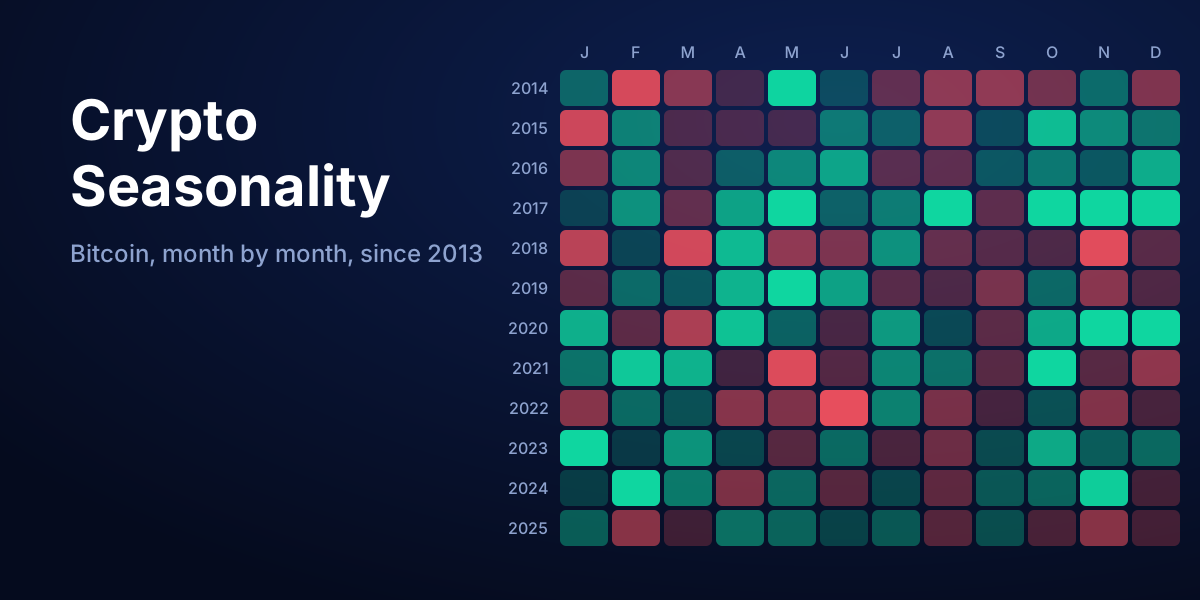
Crypto Seasonality
Is this month usually green? Every monthly return of Bitcoin since 2013 and Ethereum since 2015 in one heatmap, the best and worst months, quarters, weekdays, months by year of the four-year cycle, and every year from 1 January.
Open dashboard →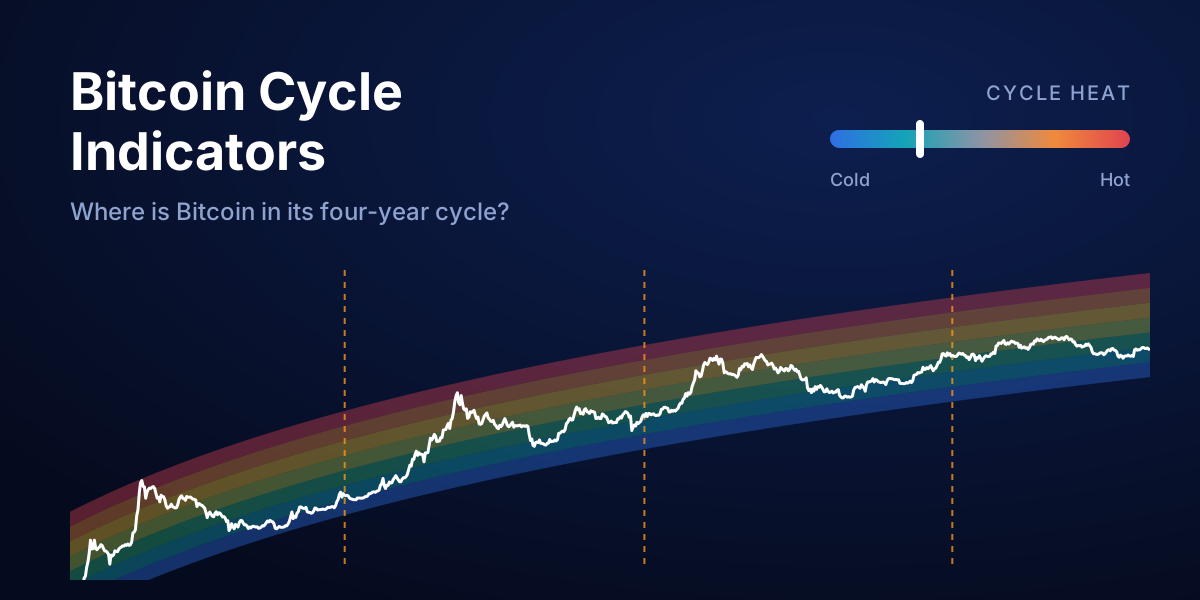
Bitcoin Cycle Indicators
Where is Bitcoin in its four-year cycle? Cycle heat, the halving countdown, the 200-week MA, Pi Cycle, Mayer Multiple, 2-Year MA and power-law bands, with readings at every past top and bottom, and the four cycles side by side.
Open dashboard →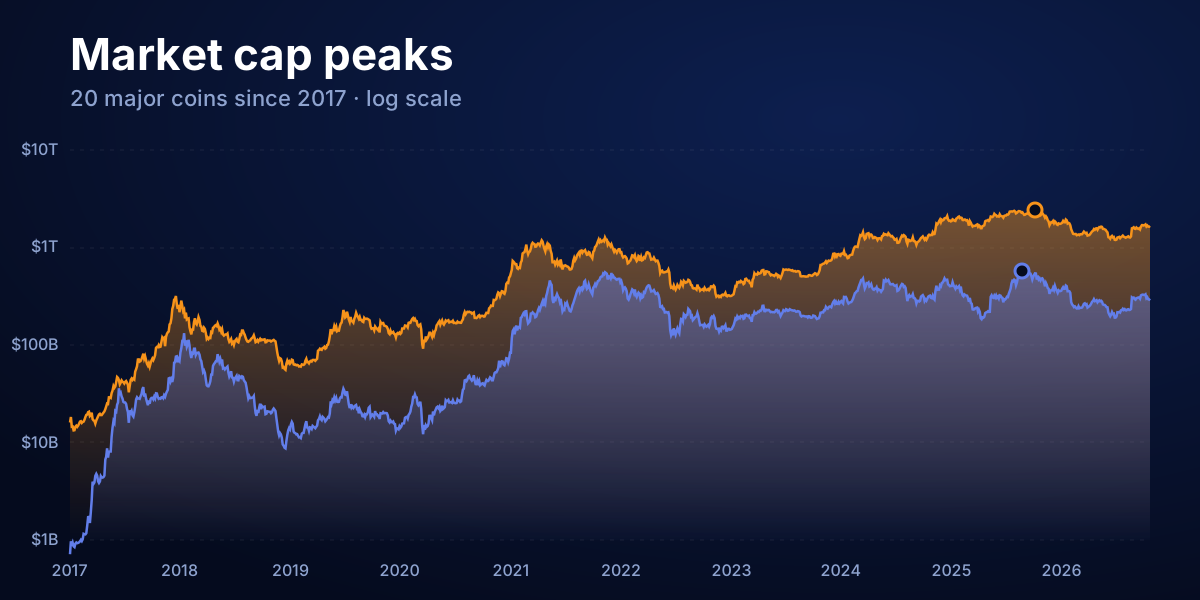
Crypto market cap peaks since 2017
Market caps of Bitcoin, Ethereum and 18 other major coins day by day since 2017, with every cycle peak marked. Tick the coins you want to compare and hover to see any day.
Open dashboard →