Price makes a new low. Every chart in your feed is red. But the indicator under the chart quietly refuses to make a new low with it. A few days later, the market turns around.
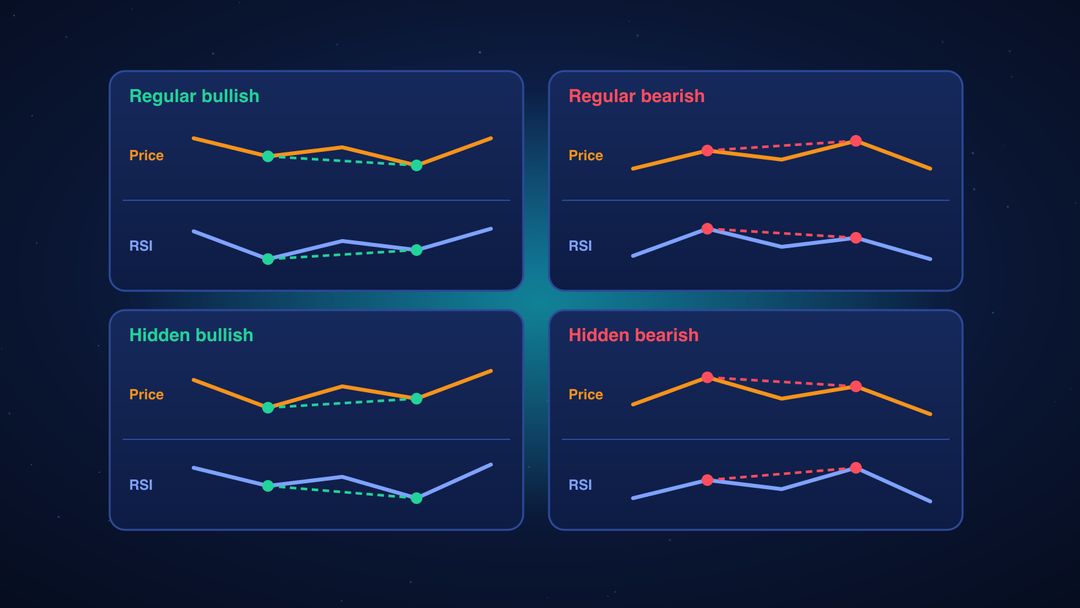
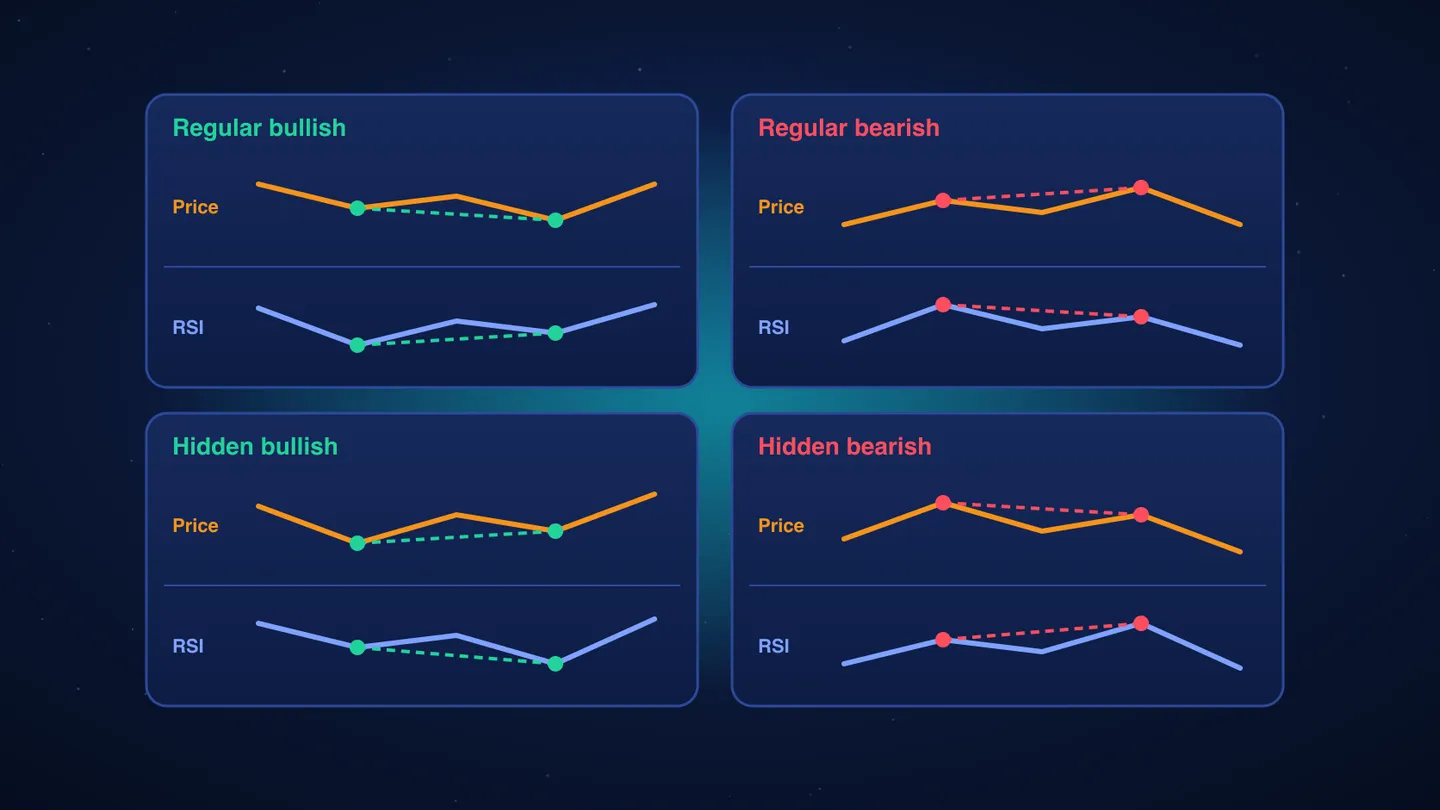
That disagreement between price and an indicator is called a divergence, and it is one of the most popular tools in technical analysis. There are two families: regular divergences, which warn that a trend may reverse, and hidden divergences, which suggest a trend will continue.
This guide explains both from scratch, walks through real Bitcoin examples, shows how traders use them, and shares what happened when we tested every divergence on 13 years of Bitcoin prices.
Part 1: The basics
Price and momentum
A price chart shows where the market is. An oscillator (an indicator that moves between fixed levels) shows how strongly it is moving. The most popular one is the RSI (Relative Strength Index), which ranges from 0 to 100:
- Above 70: the price has risen fast. Often called “overbought”.
- Below 30: the price has fallen fast. Often called “oversold”.
- Around 50: balanced.
Most of the time, price and RSI move together: a new high in price comes with a high RSI, and a new low comes with a low RSI. A divergence is when they stop agreeing.
Other indicators used for divergences include the MACD, the Stochastic oscillator and volume-based indicators like OBV. The idea is the same; this guide uses the RSI.
How to spot one
You compare two consecutive swing points, two lows or two highs, on both the price chart and the indicator:
- Find two recent lows (or highs) on the price chart.
- Look at the indicator directly below those same two points.
- Draw a line between the two price points and another between the two indicator points.
- If the lines point in different directions, you have a divergence.
The four types
| Type | Price | RSI | What it suggests |
|---|---|---|---|
| Regular bullish | Lower low | Higher low | A downtrend may be ending: possible reversal up |
| Regular bearish | Higher high | Lower high | An uptrend may be ending: possible reversal down |
| Hidden bullish | Higher low | Lower low | An uptrend is still healthy: likely continuation up |
| Hidden bearish | Lower high | Higher high | A downtrend is still in control: likely continuation down |
An easy way to remember it:
- Regular divergences appear at new extremes (new highs or new lows) and point to a reversal.
- Hidden divergences appear on pullbacks inside a trend and point to continuation.
Why divergences happen
A regular divergence shows fading momentum. In a downtrend, each push lower takes less selling force; the price still dips to a new low, but sellers are running out of energy. Like a car that is still rolling forward after the engine has stopped.
A hidden divergence shows a strong underlying trend. In an uptrend, a pullback can push the RSI quite low (it feels like a big drop), yet the price holds above its previous low. Buyers step in early, and the trend usually resumes.
Real Bitcoin examples
All examples use Bitcoin’s daily closing prices (CoinMarketCap) and a 14-day RSI.
Regular bullish: the 2026 low (June 2026)
| First low | Second low | |
|---|---|---|
| Bitcoin | $60,867 (June 6) | $58,559 (June 30): lower low |
| RSI | 15.4 | 30.0: higher low |
Bitcoin sank to a new low at the end of June, but the RSI was twice as high as at the early-June low. The selling was losing steam. June 30 turned out to be the lowest close of the year so far.
Regular bullish that worked fast (February 2026)
Bitcoin fell from $66,222 (Feb 12) to $64,080 (Feb 24), while the RSI rose slightly from 29.4 to 30.9. Two weeks after the divergence could be confirmed, Bitcoin was 10.7% higher.
Hidden bullish: a pullback that held (July–August 2026)
| First low | Second low | |
|---|---|---|
| Bitcoin | $62,239 (July 13) | $62,763 (Aug 1): higher low |
| RSI | 45.6 | 43.8: lower low |
The early-August dip pushed the RSI lower than in July, yet the price held above its July low. Buyers were defending higher prices. Over the next 30 days Bitcoin rose about 24%, to almost $80,000.
Hidden bearish: lower highs in a downtrend (November–December 2025)
Bitcoin bounced to $105,997 on November 10, fell, and bounced again only to $93,528 on December 3: a lower high. But the RSI on that second bounce was higher (49.3 vs 45.7). The rebound looked strong on the indicator, yet the price couldn’t recover its previous high. The downtrend continued, and two weeks later Bitcoin was another 2.4% lower.
A regular bearish that failed (August–September 2026)
| First high | Second high | |
|---|---|---|
| Bitcoin | $80,258 (Aug 27) | $81,272 (Sep 3): higher high |
| RSI | 82.3 | 73.0: lower high |
A textbook bearish divergence, with the RSI clearly weaker on the second high. But Bitcoin kept climbing: two weeks later it was 9.9% higher, above $86,000. A strong trend can carry a divergence for a long time, which is why confirmation and a stop-loss matter.
Part 2: How to trade divergences
Wait for confirmation
A divergence is a warning, not an entry signal. Common confirmations:
- The price breaks structure: for a bullish divergence, the price closes above the last minor high between the two lows (or above a falling trendline).
- The RSI crosses back: above 30 after a bullish divergence, below 70 after a bearish one, or across 50.
- A reversal candle: a strong close in the new direction on the timeframe you trade.
Where to put the stop
- Bullish divergence: below the second (lower) price low.
- Bearish divergence: above the second (higher) price high.
If the price breaks that level, the divergence has failed. Get out.
Use the trend as a filter
This is the most important rule, and our test below confirms it:
- Hidden divergences only make sense with the trend. Hidden bullish in an uptrend, hidden bearish in a downtrend.
- Regular divergences against a strong trend fail often, like the September 2026 example. Many traders only take them at major support or resistance levels.
A simple trend filter is the 200-day moving average: above it, the trend is up; below it, the trend is down.
Timeframes
Divergences appear on every timeframe. On the daily and weekly charts they are rarer and more meaningful. On 15-minute or 1-hour charts they appear all the time, and most are noise. Many traders spot the divergence on a higher timeframe and time the entry on a lower one.
Advanced: beyond the basic RSI divergence
Multiple divergences
Sometimes price makes three or four lower lows while the RSI keeps making higher lows. A “triple divergence” shows momentum fading for longer, but it also proves that a divergence alone can’t tell you when the turn comes.
Other kinds of divergence
- MACD histogram: reacts faster than the RSI and is popular for spotting fading momentum.
- Volume and OBV: price rising on falling volume suggests fewer buyers behind the move.
- Open interest and funding (crypto): price making new highs while open interest falls means traders are closing positions, not opening new ones. You can follow these on our Leverage & Liquidations dashboard.
- Between two assets: when Bitcoin and Ether disagree at a key high or low, traders call it SMT divergence, explained in our SMT guide.
The hindsight trap
On a finished chart, divergences look obvious. In real time, you only know a swing low was a low after the price has moved away from it. In our test below we used five days on each side, so every signal is counted five days after the second low or high, when a trader could actually have seen it. Many backtests skip this step and look far better than reality.
Our test: 13 years of Bitcoin divergences
We scanned Bitcoin’s daily chart from 2013 to November 2026 for every divergence between two consecutive swing points less than 60 days apart, using a 14-day RSI. Then we checked where Bitcoin was 14 days after each signal could be seen. We used the 200-day moving average to split signals that went with the trend from those that went against it.
For comparison: over any random 14 days, Bitcoin rose 56% of the time (median move +1.3%).
| Signal | Trend | Signals | Right after 14 days | Normal odds | Median 14-day move |
|---|---|---|---|---|---|
| Regular bullish | Down (reversal) | 22 | 59% | 56% | +3.1% |
| Hidden bullish | Up (continuation) | 31 | 52% | 56% | +0.4% |
| Regular bearish | Up (reversal) | 30 | 57% | 44% | −0.6% |
| Hidden bearish | Down (continuation) | 17 | 65% | 44% | −2.0% |
“Right” means the price moved in the direction the divergence suggested. “Normal odds” is how often Bitcoin moved in that direction over any 14 days.
What this tells us:
- Hidden bearish divergences in a downtrend were the strongest signal: right about two times in three, when a random day would have been right less than half the time.
- Bearish divergences in general did better than chance. In a market that usually goes up, spotting the moments when it doesn’t is valuable.
- Bullish divergences were barely better than chance, and hidden bullish in an uptrend was even slightly worse. In Bitcoin’s long-term uptrend, being bullish was already right most of the time; the divergence added little.
- The samples are small. 17 to 31 signals each is enough to see a tendency, not to prove a rule.
Rules to remember
- Two swing points, same places on price and indicator. Compare highs with highs, lows with lows.
- Regular = reversal, hidden = continuation.
- Respect the trend. Hidden divergences only with it; regular divergences against it need strong support or resistance.
- Wait for confirmation, then put your stop beyond the divergence’s extreme.
- Higher timeframes, fewer and better signals.
- Test before you trust. A divergence that looks perfect on a past chart may be a coin flip in real time.
The takeaway
Divergences show the gap between what the price is doing and the force behind it. For beginners, they are one of the best ways to learn how momentum works. For advanced traders, they are a useful filter, especially hidden bearish divergences in a downtrend, which stood out in our test. But no divergence works on its own: combine it with the trend, key levels and a stop-loss.
This article is for education only and is not financial advice. Data: Bitcoin daily closing prices from CoinMarketCap, January 2013 to November 2, 2026; 14-day RSI; swing points with five days on each side.
Frequently asked questions
What is a divergence in trading?
A divergence is when price and an indicator such as the RSI stop agreeing. For example, price makes a new low while the indicator does not.
What is the difference between regular and hidden divergence?
Regular divergences appear at new highs or lows and point to a reversal. Hidden divergences appear on pullbacks inside a trend and point to continuation.
How do you spot a divergence?
Compare two consecutive swing points, two lows or two highs, on both price and indicator. If the lines between them point in different directions, you have a divergence.
Do divergences work on Bitcoin?
Some do. In our test from 2013 to November 2026, hidden bearish divergences in a downtrend were right 65% of the time after 14 days, while bullish ones were barely better than chance. Samples were small.
Is a divergence an entry signal?
No, it is a warning. Wait for confirmation, such as price breaking structure, and put your stop-loss beyond the second low or high. If price breaks that level, the divergence has failed.