Macro Calendar & Crypto
A few US reports move every market, crypto included: inflation, jobs and the Fed’s rate decisions. Here is when the next ones come out, what the last ones said, and what Bitcoin did around all 277 inflation and jobs reports since 2019, hour by hour.
It’s out. This page adds the figures and Bitcoin’s reaction at its next update.
Last time: 3.7%, core 2.6%. Since 2019 Bitcoin moved 1.1% on average in the first hour.Coming up
The next US reports and Fed decisions, in your time zone. Inflation and jobs reports come out at 8:30 am New York time, Fed decisions at 2:00 pm.
| Date | Your time | Report | Data for | Last time | Typical first hour |
|---|---|---|---|---|---|
| Tue 10 Nov | 8:30 am NY | CPI Consumer prices (CPI) | Oct 2026 | 3.7%, core 2.6% | 1.1% |
| Fri 13 Nov | 8:30 am NY | PPI Producer prices (PPI) | Oct 2026 | 6.3% | 0.5% |
| Fri 4 Dec | 8:30 am NY | Jobs Jobs report | Nov 2026 | +165K jobs, 4.1% | 0.6% |
| Wed 9 Dec | 2:00 pm NY | FOMC Fed rate decision | – | 3.75–4.00% (hold) | 1.2% |
| Thu 10 Dec | 8:30 am NY | CPI Consumer prices (CPI) | Nov 2026 | 3.7%, core 2.6% | 1.1% |
| Tue 15 Dec | 8:30 am NY | PPI Producer prices (PPI) | Nov 2026 | 6.3% | 0.5% |
| Fri 8 Jan | 8:30 am NY | Jobs Jobs report | Dec 2026 | +165K jobs, 4.1% | 0.6% |
| Wed 13 Jan | 8:30 am NY | CPI Consumer prices (CPI) | Dec 2026 | 3.7%, core 2.6% | 1.1% |
| Thu 14 Jan | 8:30 am NY | PPI Producer prices (PPI) | Dec 2026 | 6.3% | 0.5% |
| Wed 27 Jan | 2:00 pm NY | FOMC Fed rate decision | – | 3.75–4.00% (hold) | 1.2% |
| Fri 5 Feb | 8:30 am NY | Jobs Jobs report | Jan 2027 | +165K jobs, 4.1% | 0.6% |
| Thu 11 Feb | 8:30 am NY | CPI Consumer prices (CPI) | Jan 2027 | 3.7%, core 2.6% | 1.1% |
“Typical first hour”: Bitcoin’s average move, up or down, in the hour after this kind of report since 2019 (for Fed decisions, the hour after the statement).
Which report moves Bitcoin most
Average size of Bitcoin’s move, up or down, after each kind of report since 2019. On a normal day Bitcoin moves 2.1%. The biggest release-day moves came with Fed rate decisions.
The thin line in “Release day” marks a normal day (2.1%). Days are measured close to close (00:00 UTC).
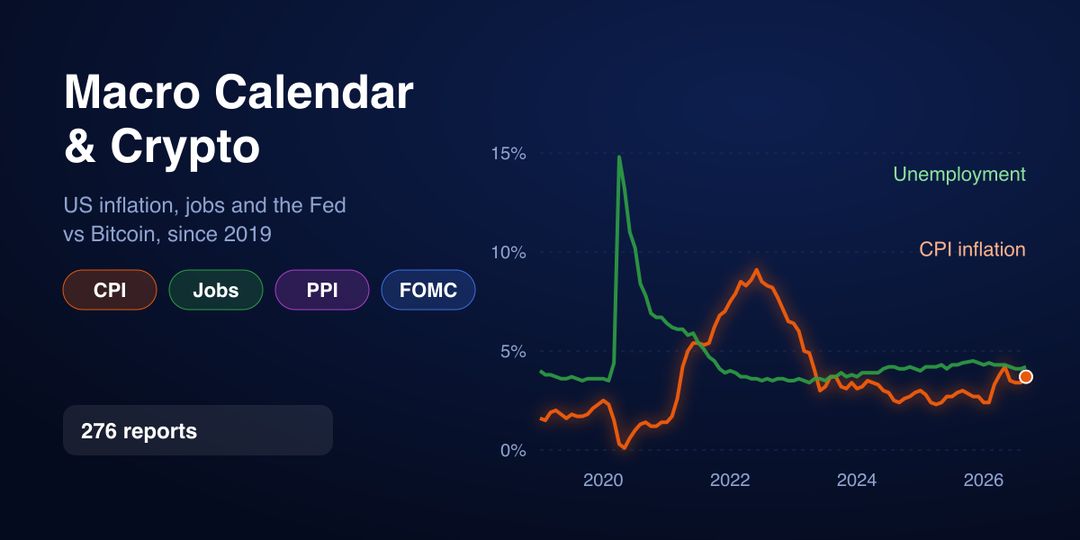
Inflation, jobs and the Fed rate, with Bitcoin
Each line is the figure as it stands today (later revisions included), by the month it describes. Hover or tap for the values.
Hour by hour around a report
Bitcoin’s median price from 12 hours before to 36 hours after each kind of report, compared with the price at the moment it came out (0%). Dashed: CPI reports where inflation came in higher or lower than the month before.
Hotter or cooler than the month before
Median Bitcoin change, grouped by what the report showed compared with the one before: inflation over 12 months up (“hotter”) or down (“cooler”), unemployment up or down. Minutes and hours are measured from the price at the release; days from the close of the day before.
| Reports | 15 minutes | 1 hour | Release day | Next day | 1 week | Up the next day | |
|---|---|---|---|---|---|---|---|
| Consumer prices (CPI) | |||||||
| All CPI reports | 92 | +0.1% | +0.1% | +0.1% | +0.8% | +1.3% | 58% |
| CPI hotter | 43 | +0.1% | +0.2% | 0.0% | 0.0% | +0.9% | 49% |
| CPI cooler | 39 | +0.1% | 0.0% | +0.5% | +1.0% | +2.7% | 69% |
| CPI unchanged | 9 | +0.1% | +0.4% | 0.0% | +0.8% | +1.9% | 56% |
| Jobs report | |||||||
| All Jobs reports | 93 | 0.0% | 0.0% | +0.1% | −0.1% | +0.8% | 48% |
| Unemployment up | 25 | 0.0% | 0.0% | −0.4% | +1.0% | +0.8% | 56% |
| Unemployment down | 44 | 0.0% | 0.0% | 0.0% | −0.2% | +0.9% | 43% |
| Unemployment unchanged | 24 | +0.1% | +0.1% | +0.4% | +0.2% | 0.0% | 50% |
| Producer prices (PPI) | |||||||
| All PPI reports | 92 | 0.0% | +0.2% | −0.3% | +0.3% | +0.5% | 52% |
| PPI hotter | 49 | 0.0% | +0.1% | −0.7% | +0.2% | +0.5% | 51% |
| PPI cooler | 34 | +0.1% | +0.1% | 0.0% | +0.3% | +0.5% | 56% |
| PPI unchanged | 8 | +0.2% | +0.3% | −0.3% | −0.1% | +0.4% | 50% |
| For comparison | |||||||
| All FOMC decisions | 64 | – | +0.1% | +0.4% | +0.3% | +0.7% | 56% |
A median is the middle value: half the reports did better, half did worse. Markets react to the surprise against what economists expected, which free data doesn’t cover, so “hotter” and “cooler” here compare with the month before. That is a rougher signal, which is why the groups differ less than you might think.
Every report since 2019
Click a row to see Bitcoin hour by hour, from 12 hours before the release to 36 hours after.
| Release | Report | Figure | vs before | BTC at release | 15 min | 1 hour | Release day | Next day | 1 week |
|---|---|---|---|---|---|---|---|---|---|
| 6 Nov 2026 | Jobs Oct 2026 | +165K jobsunemployment 4.1% | Unemployment ▼ | $75,936 | −0.3% | −0.6% | −0.3% | −0.3% | – |
Jobs report for October 2026: +165K jobs (unemployment 4.1%).
| |||||||||
| 15 Oct 2026 | PPI Sept 2026 | 6.3%month +1.3% | Hotter ▲ | $80,964 | −0.2% | −1.0% | +0.7% | −0.1% | −0.3% |
Producer prices (PPI) for September 2026: 6.3% (month +1.3%).
| |||||||||
| 14 Oct 2026 | CPI Sept 2026 | 3.7%core 2.6% · month +0.6% | Hotter ▲ | $83,801 | −1.2% | −1.5% | −1.8% | −1.1% | +1.1% |
Consumer prices (CPI) for September 2026: 3.7% (core 2.6% · month +0.6%).
| |||||||||
| 2 Oct 2026 | Jobs Sept 2026 | +60K jobsunemployment 4.2% | Unemployment ▲ | $86,609 | −0.2% | 0.0% | −0.4% | −0.1% | −2.7% |
Jobs report for September 2026: +60K jobs (unemployment 4.2%).
| |||||||||
| 11 Sept 2026 | CPI Aug 2026 | 3.4%core 2.4% · month +0.4% | Unchanged | $77,064 | +0.6% | +0.5% | +0.8% | +0.9% | +5.7% |
Consumer prices (CPI) for August 2026: 3.4% (core 2.4% · month +0.4%).
| |||||||||
| 10 Sept 2026 | PPI Aug 2026 | 5.6%month +0.5% | Hotter ▲ | $77,781 | −0.9% | −1.1% | −2.2% | −1.4% | −2.4% |
Producer prices (PPI) for August 2026: 5.6% (month +0.5%).
| |||||||||
| 4 Sept 2026 | Jobs Aug 2026 | +186K jobsunemployment 4.1% | Unemployment = | $81,336 | −2.0% | −2.5% | −2.0% | −1.8% | −5.0% |
Jobs report for August 2026: +186K jobs (unemployment 4.1%).
| |||||||||
| 13 Aug 2026 | PPI Jul 2026 | 4.9%month +0.2% | Cooler ▼ | $63,497 | 0.0% | 0.0% | 0.0% | −0.7% | +15.2% |
Producer prices (PPI) for July 2026: 4.9% (month +0.2%).
| |||||||||
| 12 Aug 2026 | CPI Jul 2026 | 3.4%core 2.5% · month +0.1% | Cooler ▼ | $64,356 | −0.5% | −0.7% | −0.2% | −0.2% | +9.0% |
Consumer prices (CPI) for July 2026: 3.4% (core 2.5% · month +0.1%).
| |||||||||
| 7 Aug 2026 | Jobs Jul 2026 | −10K jobsunemployment 4.1% | Unemployment ▼ | $65,075 | +0.1% | +0.1% | +1.0% | +1.0% | −2.0% |
Jobs report for July 2026: −10K jobs (unemployment 4.1%).
| |||||||||
| 15 Jul 2026 | PPI Jun 2026 | 5.6%month −0.1% | Cooler ▼ | $64,625 | +0.2% | +1.0% | −0.4% | −1.8% | +1.8% |
Producer prices (PPI) for June 2026: 5.6% (month −0.1%).
| |||||||||
| 14 Jul 2026 | CPI Jun 2026 | 3.5%core 2.6% · month −0.4% | Cooler ▼ | $62,895 | +1.0% | +1.6% | +4.4% | +4.0% | +6.9% |
Consumer prices (CPI) for June 2026: 3.5% (core 2.6% · month −0.4%).
| |||||||||
| 2 Jul 2026 | Jobs Jun 2026 | +31K jobsunemployment 4.2% | Unemployment ▼ | $61,264 | +0.1% | +0.6% | +2.5% | +4.2% | +5.3% |
Jobs report for June 2026: +31K jobs (unemployment 4.2%).
| |||||||||
| 11 Jun 2026 | PPI May 2026 | 5.9%month +0.5% | Hotter ▲ | $62,616 | +0.4% | +0.2% | +3.4% | +3.4% | +2.4% |
Producer prices (PPI) for May 2026: 5.9% (month +0.5%).
| |||||||||
| 10 Jun 2026 | CPI May 2026 | 4.2%core 2.9% · month +0.5% | Hotter ▲ | $61,117 | +0.9% | +0.6% | −0.3% | +3.1% | +4.5% |
Consumer prices (CPI) for May 2026: 4.2% (core 2.9% · month +0.5%).
| |||||||||
| 5 Jun 2026 | Jobs May 2026 | +63K jobsunemployment 4.3% | Unemployment = | $62,162 | −0.4% | −0.2% | −4.5% | −4.6% | −0.4% |
Jobs report for May 2026: +63K jobs (unemployment 4.3%).
| |||||||||
| 13 May 2026 | PPI Apr 2026 | 5.7%month +1.1% | Hotter ▲ | $80,331 | −0.3% | −0.3% | −1.5% | +0.7% | −3.8% |
Producer prices (PPI) for April 2026: 5.7% (month +1.1%).
| |||||||||
| 12 May 2026 | CPI Apr 2026 | 3.8%core 2.8% · month +0.6% | Hotter ▲ | $80,795 | +0.1% | −0.2% | −1.5% | −3.0% | −6.1% |
Consumer prices (CPI) for April 2026: 3.8% (core 2.8% · month +0.6%).
| |||||||||
| 8 May 2026 | Jobs Apr 2026 | +148K jobsunemployment 4.3% | Unemployment = | $80,322 | −0.1% | −0.9% | +0.2% | +0.8% | −1.2% |
Jobs report for April 2026: +148K jobs (unemployment 4.3%).
| |||||||||
| 14 Apr 2026 | PPI Mar 2026 | 4.3%month +0.8% | Hotter ▲ | $74,324 | 0.0% | +0.3% | −0.4% | +0.4% | +2.5% |
Producer prices (PPI) for March 2026: 4.3% (month +0.8%).
| |||||||||
| 10 Apr 2026 | CPI Mar 2026 | 3.3%core 2.6% · month +0.9% | Hotter ▲ | $72,200 | +0.2% | +0.2% | +1.7% | +1.8% | +7.5% |
Consumer prices (CPI) for March 2026: 3.3% (core 2.6% · month +0.9%).
| |||||||||
| 3 Apr 2026 | Jobs Mar 2026 | +214K jobsunemployment 4.3% | Unemployment ▼ | $67,118 | −0.4% | −0.6% | +0.1% | +0.6% | +9.1% |
Jobs report for March 2026: +214K jobs (unemployment 4.3%).
| |||||||||
| 18 Mar 2026 | PPI Feb 2026 | 3.4%month +0.5% | Hotter ▲ | $72,836 | −0.5% | −0.5% | −3.6% | −5.4% | −3.5% |
Producer prices (PPI) for February 2026: 3.4% (month +0.5%).
| |||||||||
| 11 Mar 2026 | CPI Feb 2026 | 2.4%core 2.5% · month +0.3% | Unchanged | $69,440 | −0.3% | +1.1% | +0.4% | +0.8% | +1.9% |
Consumer prices (CPI) for February 2026: 2.4% (core 2.5% · month +0.3%).
| |||||||||
| 6 Mar 2026 | Jobs Feb 2026 | −156K jobsunemployment 4.4% | Unemployment ▲ | $70,060 | 0.0% | −1.5% | −3.8% | −5.0% | +0.2% |
Jobs report for February 2026: −156K jobs (unemployment 4.4%).
| |||||||||
| 27 Feb 2026 | PPI Jan 2026 | 3.1%month +0.6% | Unchanged | $66,007 | 0.0% | +0.2% | −2.3% | −0.7% | +1.0% |
Producer prices (PPI) for January 2026: 3.1% (month +0.6%).
| |||||||||
| 13 Feb 2026 | CPI Jan 2026 | 2.4%core 2.5% · month +0.2% | Cooler ▼ | $67,283 | 0.0% | 0.0% | +4.0% | +5.4% | +2.7% |
Consumer prices (CPI) for January 2026: 2.4% (core 2.5% · month +0.2%).
| |||||||||
| 11 Feb 2026 | Jobs Jan 2026 | +160K jobsunemployment 4.3% | Unemployment ▼ | $66,987 | +0.3% | +1.5% | −2.6% | −3.7% | −3.4% |
Jobs report for January 2026: +160K jobs (unemployment 4.3%).
| |||||||||
| 30 Jan 2026 | PPI Dec 2025 | 3.1%month +0.4% | Unchanged | $82,551 | +0.3% | +0.4% | −0.5% | −7.0% | −16.6% |
Producer prices (PPI) for December 2025: 3.1% (month +0.4%).
| |||||||||
| 14 Jan 2026 | PPI Nov 2025 | 3.1%month +0.4% | Hotter ▲ | $95,158 | −0.1% | +0.5% | +1.7% | +0.2% | −6.2% |
Producer prices (PPI) for November 2025: 3.1% (month +0.4%).
| |||||||||
| 13 Jan 2026 | CPI Dec 2025 | 2.7%core 2.6% · month +0.3% | Unchanged | $92,050 | +0.1% | +0.3% | +4.5% | +6.3% | −3.2% |
Consumer prices (CPI) for December 2025: 2.7% (core 2.6% · month +0.3%).
| |||||||||
| 9 Jan 2026 | Jobs Dec 2025 | −17K jobsunemployment 4.4% | Unemployment ▼ | $90,496 | 0.0% | 0.0% | −0.6% | −0.7% | +4.9% |
Jobs report for December 2025: −17K jobs (unemployment 4.4%).
| |||||||||
| 18 Dec 2025 | CPI Nov 2025 | 2.7%core 2.6% · month – | Cooler ▼ | $87,602 | +1.3% | +1.0% | −0.8% | +2.3% | +1.3% |
Consumer prices (CPI) for November 2025: 2.7% (core 2.6% · month –).
| |||||||||
| 16 Dec 2025 | Jobs Nov 2025 | +41K jobsunemployment 4.5% | Unemployment ▲ | $87,353 | −0.5% | −0.5% | +1.6% | −0.3% | +1.2% |
Jobs report for November 2025: +41K jobs (unemployment 4.5%).
| |||||||||
| 25 Nov 2025 | PPI Sept 2025 | 3.0%month +0.6% | Hotter ▲ | $87,586 | −0.7% | −0.5% | −1.1% | +2.5% | +3.5% |
Producer prices (PPI) for September 2025: 3.0% (month +0.6%).
| |||||||||
| 20 Nov 2025 | Jobs Sept 2025 | +76K jobsunemployment 4.4% | Unemployment ▲ | $91,832 | −0.3% | −0.5% | −5.3% | −7.0% | −0.2% |
Jobs report for September 2025: +76K jobs (unemployment 4.4%).
| |||||||||
| 24 Oct 2025 | CPI Sept 2025 | 3.0%core 3.0% · month +0.3% | Hotter ▲ | $111,022 | +0.5% | +0.2% | +0.9% | +1.4% | −0.5% |
Consumer prices (CPI) for September 2025: 3.0% (core 3.0% · month +0.3%).
| |||||||||
| 11 Sept 2025 | CPI Aug 2025 | 2.9%core 3.1% · month +0.3% | Hotter ▲ | $114,411 | −0.5% | −0.6% | +1.4% | +1.9% | +2.8% |
Consumer prices (CPI) for August 2025: 2.9% (core 3.1% · month +0.3%).
| |||||||||
| 10 Sept 2025 | PPI Aug 2025 | 2.7%month −0.2% | Cooler ▼ | $112,576 | +0.6% | +1.0% | +2.2% | +3.6% | +4.4% |
Producer prices (PPI) for August 2025: 2.7% (month −0.2%).
| |||||||||
| 5 Sept 2025 | Jobs Aug 2025 | −70K jobsunemployment 4.3% | Unemployment = | $112,608 | +0.1% | +0.3% | −0.1% | −0.5% | +4.9% |
Jobs report for August 2025: −70K jobs (unemployment 4.3%).
| |||||||||
| 14 Aug 2025 | PPI Jul 2025 | 3.2%month +0.8% | Hotter ▲ | $121,193 | −1.3% | −2.4% | −4.0% | −4.8% | −8.9% |
Producer prices (PPI) for July 2025: 3.2% (month +0.8%).
| |||||||||
| 12 Aug 2025 | CPI Jul 2025 | 2.7%core 3.1% · month +0.2% | Unchanged | $118,471 | +0.5% | +0.6% | +1.2% | +3.9% | −5.0% |
Consumer prices (CPI) for July 2025: 2.7% (core 3.1% · month +0.2%).
| |||||||||
| 1 Aug 2025 | Jobs Jul 2025 | +64K jobsunemployment 4.3% | Unemployment ▲ | $115,410 | +0.4% | +0.2% | −2.1% | −2.8% | +0.8% |
Jobs report for July 2025: +64K jobs (unemployment 4.3%).
| |||||||||
| 16 Jul 2025 | PPI Jun 2025 | 2.4%month +0.2% | Cooler ▼ | $118,934 | 0.0% | −0.1% | +0.8% | +1.3% | +0.8% |
Producer prices (PPI) for June 2025: 2.4% (month +0.2%).
| |||||||||
| 15 Jul 2025 | CPI Jun 2025 | 2.7%core 2.9% · month +0.3% | Hotter ▲ | $116,921 | −0.3% | +0.6% | −1.7% | −0.9% | +0.1% |
Consumer prices (CPI) for June 2025: 2.7% (core 2.9% · month +0.3%).
| |||||||||
| 3 Jul 2025 | Jobs Jun 2025 | −20K jobsunemployment 4.1% | Unemployment ▼ | $109,662 | −0.6% | −0.3% | +0.7% | −0.8% | +6.5% |
Jobs report for June 2025: −20K jobs (unemployment 4.1%).
| |||||||||
| 12 Jun 2025 | PPI May 2025 | 2.7%month +0.3% | Hotter ▲ | $107,000 | +0.4% | −0.1% | −2.5% | −2.4% | −3.7% |
Producer prices (PPI) for May 2025: 2.7% (month +0.3%).
| |||||||||
| 11 Jun 2025 | CPI May 2025 | 2.4%core 2.8% · month +0.1% | Hotter ▲ | $109,292 | +0.5% | +0.5% | −1.4% | −3.9% | −4.9% |
Consumer prices (CPI) for May 2025: 2.4% (core 2.8% · month +0.1%).
| |||||||||
| 6 Jun 2025 | Jobs May 2025 | +13K jobsunemployment 4.3% | Unemployment ▲ | $103,931 | −0.1% | +0.1% | +2.8% | +4.0% | +4.4% |
Jobs report for May 2025: +13K jobs (unemployment 4.3%).
| |||||||||
| 15 May 2025 | PPI Apr 2025 | 2.4%month −0.3% | Cooler ▼ | $102,569 | +0.2% | 0.0% | +0.2% | 0.0% | +7.9% |
Producer prices (PPI) for April 2025: 2.4% (month −0.3%).
| |||||||||
| 13 May 2025 | CPI Apr 2025 | 2.3%core 2.8% · month +0.2% | Cooler ▼ | $103,579 | +0.2% | +0.2% | +1.3% | +0.7% | +3.9% |
Consumer prices (CPI) for April 2025: 2.3% (core 2.8% · month +0.2%).
| |||||||||
| 2 May 2025 | Jobs Apr 2025 | +108K jobsunemployment 4.2% | Unemployment = | $96,825 | +0.2% | +0.2% | +0.4% | −0.6% | +6.7% |
Jobs report for April 2025: +108K jobs (unemployment 4.2%).
| |||||||||
| 11 Apr 2025 | PPI Mar 2025 | 3.2%month −0.1% | Cooler ▼ | $82,220 | +0.1% | −0.2% | +4.7% | +7.1% | +6.1% |
Producer prices (PPI) for March 2025: 3.2% (month −0.1%).
| |||||||||
| 10 Apr 2025 | CPI Mar 2025 | 2.4%core 2.8% · month 0.0% | Cooler ▼ | $81,969 | −0.2% | −0.3% | −3.6% | +1.0% | +2.8% |
Consumer prices (CPI) for March 2025: 2.4% (core 2.8% · month 0.0%).
| |||||||||
| 4 Apr 2025 | Jobs Mar 2025 | +67K jobsunemployment 4.2% | Unemployment = | $82,467 | +0.3% | +0.1% | +0.9% | +0.5% | +0.4% |
Jobs report for March 2025: +67K jobs (unemployment 4.2%).
| |||||||||
| 13 Mar 2025 | PPI Feb 2025 | 3.4%month +0.2% | Cooler ▼ | $83,243 | −0.3% | −0.4% | −3.2% | +0.3% | +0.5% |
Producer prices (PPI) for February 2025: 3.4% (month +0.2%).
| |||||||||
| 12 Mar 2025 | CPI Feb 2025 | 2.8%core 3.1% · month +0.2% | Cooler ▼ | $83,341 | +0.3% | 0.0% | +1.0% | −2.2% | +4.8% |
Consumer prices (CPI) for February 2025: 2.8% (core 3.1% · month +0.2%).
| |||||||||
| 7 Mar 2025 | Jobs Feb 2025 | +42K jobsunemployment 4.2% | Unemployment ▲ | $89,439 | +0.8% | −0.4% | −3.6% | −4.2% | −6.7% |
Jobs report for February 2025: +42K jobs (unemployment 4.2%).
| |||||||||
| 13 Feb 2025 | PPI Jan 2025 | 3.8%month +0.6% | Hotter ▲ | $95,852 | +0.2% | +0.1% | −1.3% | −0.4% | +0.5% |
Producer prices (PPI) for January 2025: 3.8% (month +0.6%).
| |||||||||
| 12 Feb 2025 | CPI Jan 2025 | 3.0%core 3.3% · month +0.4% | Hotter ▲ | $96,511 | −2.1% | −1.9% | +2.2% | +0.9% | +0.9% |
Consumer prices (CPI) for January 2025: 3.0% (core 3.3% · month +0.4%).
| |||||||||
| 7 Feb 2025 | Jobs Jan 2025 | −48K jobsunemployment 4.0% | Unemployment ▼ | $97,720 | +0.7% | +2.0% | −0.1% | −0.1% | +0.9% |
Jobs report for January 2025: −48K jobs (unemployment 4.0%).
| |||||||||
| 15 Jan 2025 | CPI Dec 2024 | 2.9%core 3.2% · month +0.3% | Hotter ▲ | $97,255 | +1.3% | +1.5% | +4.1% | +3.3% | +7.4% |
Consumer prices (CPI) for December 2024: 2.9% (core 3.2% · month +0.3%).
| |||||||||
| 14 Jan 2025 | PPI Dec 2024 | 3.5%month +0.4% | Hotter ▲ | $95,875 | +0.4% | +0.9% | +2.1% | +6.3% | +12.3% |
Producer prices (PPI) for December 2024: 3.5% (month +0.4%).
| |||||||||
| 10 Jan 2025 | Jobs Dec 2024 | +237K jobsunemployment 4.1% | Unemployment ▼ | $94,813 | −1.3% | −0.4% | +2.4% | +2.3% | +13.0% |
Jobs report for December 2024: +237K jobs (unemployment 4.1%).
| |||||||||
| 12 Dec 2024 | PPI Nov 2024 | 2.9%month +0.1% | Hotter ▲ | $101,291 | −0.2% | +0.2% | −1.1% | +0.3% | −3.6% |
Producer prices (PPI) for November 2024: 2.9% (month +0.1%).
| |||||||||
| 11 Dec 2024 | CPI Nov 2024 | 2.7%core 3.3% · month +0.3% | Hotter ▲ | $98,424 | +0.3% | +0.3% | +4.7% | +3.5% | +3.5% |
Consumer prices (CPI) for November 2024: 2.7% (core 3.3% · month +0.3%).
| |||||||||
| 6 Dec 2024 | Jobs Nov 2024 | +134K jobsunemployment 4.2% | Unemployment ▲ | $98,118 | +0.7% | +1.3% | +3.4% | +3.4% | +5.0% |
Jobs report for November 2024: +134K jobs (unemployment 4.2%).
| |||||||||
| 14 Nov 2024 | PPI Oct 2024 | 2.8%month +0.3% | Hotter ▲ | $90,989 | 0.0% | +0.4% | −3.7% | +0.5% | +8.7% |
Producer prices (PPI) for October 2024: 2.8% (month +0.3%).
| |||||||||
| 13 Nov 2024 | CPI Oct 2024 | 2.6%core 3.3% · month +0.3% | Hotter ▲ | $88,421 | +1.0% | +1.7% | +3.0% | −0.8% | +7.3% |
Consumer prices (CPI) for October 2024: 2.6% (core 3.3% · month +0.3%).
| |||||||||
| 1 Nov 2024 | Jobs Oct 2024 | +33K jobsunemployment 4.1% | Unemployment = | $70,027 | +0.3% | +0.2% | −1.0% | −1.3% | +9.0% |
Jobs report for October 2024: +33K jobs (unemployment 4.1%).
| |||||||||
| 11 Oct 2024 | PPI Sept 2024 | 2.1%month +0.3% | Unchanged | $61,231 | −0.1% | +0.3% | +3.6% | +4.8% | +13.5% |
Producer prices (PPI) for September 2024: 2.1% (month +0.3%).
| |||||||||
| 10 Oct 2024 | CPI Sept 2024 | 2.4%core 3.3% · month +0.2% | Cooler ▼ | $61,196 | −0.5% | −0.2% | −0.5% | +3.1% | +11.3% |
Consumer prices (CPI) for September 2024: 2.4% (core 3.3% · month +0.2%).
| |||||||||
| 4 Oct 2024 | Jobs Sept 2024 | +155K jobsunemployment 4.1% | Unemployment ▼ | $61,561 | −0.4% | 0.0% | +2.2% | +2.2% | +2.8% |
Jobs report for September 2024: +155K jobs (unemployment 4.1%).
| |||||||||
| 12 Sept 2024 | PPI Aug 2024 | 2.1%month +0.3% | Cooler ▼ | $58,117 | −0.6% | −0.6% | +1.4% | +5.6% | +9.8% |
Producer prices (PPI) for August 2024: 2.1% (month +0.3%).
| |||||||||
| 11 Sept 2024 | CPI Aug 2024 | 2.5%core 3.2% · month +0.2% | Cooler ▼ | $56,832 | −0.6% | 0.0% | −0.5% | +0.8% | +6.9% |
Consumer prices (CPI) for August 2024: 2.5% (core 3.2% · month +0.2%).
| |||||||||
| 6 Sept 2024 | Jobs Aug 2024 | +9K jobsunemployment 4.2% | Unemployment = | $55,906 | +1.0% | +1.5% | −3.9% | −3.6% | +7.9% |
Jobs report for August 2024: +9K jobs (unemployment 4.2%).
| |||||||||
| 14 Aug 2024 | CPI Jul 2024 | 2.9%core 3.2% · month +0.2% | Cooler ▼ | $61,711 | −0.7% | −1.4% | −3.1% | −5.0% | +0.9% |
Consumer prices (CPI) for July 2024: 2.9% (core 3.2% · month +0.2%).
| |||||||||
| 13 Aug 2024 | PPI Jul 2024 | 2.4%month 0.0% | Cooler ▼ | $58,863 | +0.1% | +0.2% | +2.1% | −1.0% | −0.6% |
Producer prices (PPI) for July 2024: 2.4% (month 0.0%).
| |||||||||
| 2 Aug 2024 | Jobs Jul 2024 | +53K jobsunemployment 4.2% | Unemployment ▲ | $64,464 | −0.2% | +0.6% | −6.0% | −7.2% | −6.9% |
Jobs report for July 2024: +53K jobs (unemployment 4.2%).
| |||||||||
| 12 Jul 2024 | PPI Jun 2024 | 2.9%month +0.4% | Hotter ▲ | $57,450 | −0.4% | +0.2% | +1.0% | +3.3% | +16.3% |
Producer prices (PPI) for June 2024: 2.9% (month +0.4%).
| |||||||||
| 11 Jul 2024 | CPI Jun 2024 | 3.0%core 3.3% · month 0.0% | Cooler ▼ | $58,701 | +0.4% | +0.2% | −0.7% | +0.3% | +10.8% |
Consumer prices (CPI) for June 2024: 3.0% (core 3.3% · month 0.0%).
| |||||||||
| 5 Jul 2024 | Jobs Jun 2024 | +87K jobsunemployment 4.1% | Unemployment ▲ | $55,630 | −0.6% | −0.2% | −0.6% | +2.3% | +1.6% |
Jobs report for June 2024: +87K jobs (unemployment 4.1%).
| |||||||||
| 13 Jun 2024 | PPI May 2024 | 2.5%month 0.0% | Hotter ▲ | $67,852 | −0.2% | +0.3% | −2.2% | −3.3% | −5.0% |
Producer prices (PPI) for May 2024: 2.5% (month 0.0%).
| |||||||||
| 12 Jun 2024 | CPI May 2024 | 3.3%core 3.4% · month 0.0% | Cooler ▼ | $67,999 | +2.1% | +1.8% | +1.4% | −0.9% | −3.5% |
Consumer prices (CPI) for May 2024: 3.3% (core 3.4% · month 0.0%).
| |||||||||
| 7 Jun 2024 | Jobs May 2024 | +78K jobsunemployment 3.9% | Unemployment = | $71,896 | −1.3% | −0.8% | −2.0% | −2.1% | −6.7% |
Jobs report for May 2024: +78K jobs (unemployment 3.9%).
| |||||||||
| 15 May 2024 | CPI Apr 2024 | 3.4%core 3.6% · month +0.2% | Cooler ▼ | $62,680 | +1.6% | +2.6% | +7.7% | +6.0% | +12.3% |
Consumer prices (CPI) for April 2024: 3.4% (core 3.6% · month +0.2%).
| |||||||||
| 14 May 2024 | PPI Apr 2024 | 2.3%month +0.5% | Hotter ▲ | $61,914 | −0.3% | +0.1% | −2.1% | +5.4% | +11.5% |
Producer prices (PPI) for April 2024: 2.3% (month +0.5%).
| |||||||||
| 3 May 2024 | Jobs Apr 2024 | +64K jobsunemployment 3.9% | Unemployment = | $59,135 | +2.2% | +3.6% | +6.4% | +8.1% | +2.8% |
Jobs report for April 2024: +64K jobs (unemployment 3.9%).
| |||||||||
| 11 Apr 2024 | PPI Mar 2024 | 2.0%month +0.1% | Hotter ▲ | $69,987 | +1.2% | +1.1% | −0.7% | −4.8% | −10.0% |
Producer prices (PPI) for March 2024: 2.0% (month +0.1%).
| |||||||||
| 10 Apr 2024 | CPI Mar 2024 | 3.5%core 3.8% · month +0.4% | Hotter ▲ | $68,968 | −1.5% | −1.9% | +2.1% | +1.3% | −11.4% |
Consumer prices (CPI) for March 2024: 3.5% (core 3.8% · month +0.4%).
| |||||||||
| 5 Apr 2024 | Jobs Mar 2024 | +228K jobsunemployment 3.9% | Unemployment = | $66,760 | −0.5% | +0.2% | −1.0% | +0.6% | −1.9% |
Jobs report for March 2024: +228K jobs (unemployment 3.9%).
| |||||||||
| 14 Mar 2024 | PPI Feb 2024 | 1.6%month +0.5% | Hotter ▲ | $72,812 | −0.1% | −0.3% | −2.3% | −5.0% | −10.4% |
Producer prices (PPI) for February 2024: 1.6% (month +0.5%).
| |||||||||
| 12 Mar 2024 | CPI Feb 2024 | 3.2%core 3.8% · month +0.4% | Hotter ▲ | $71,645 | +0.6% | +0.9% | −0.9% | +1.3% | −14.2% |
Consumer prices (CPI) for February 2024: 3.2% (core 3.8% · month +0.4%).
| |||||||||
| 8 Mar 2024 | Jobs Feb 2024 | +206K jobsunemployment 3.9% | Unemployment ▲ | $67,524 | +0.4% | +0.8% | +2.1% | +2.4% | +3.7% |
Jobs report for February 2024: +206K jobs (unemployment 3.9%).
| |||||||||
| 16 Feb 2024 | PPI Jan 2024 | 1.0%month +0.3% | Cooler ▼ | $52,369 | −0.1% | −0.3% | +0.4% | −0.5% | −2.3% |
Producer prices (PPI) for January 2024: 1.0% (month +0.3%).
| |||||||||
| 13 Feb 2024 | CPI Jan 2024 | 3.1%core 3.9% · month +0.3% | Cooler ▼ | $49,782 | −0.5% | −1.6% | −0.4% | +3.7% | +4.7% |
Consumer prices (CPI) for January 2024: 3.1% (core 3.9% · month +0.3%).
| |||||||||
| 2 Feb 2024 | Jobs Jan 2024 | +175K jobsunemployment 3.7% | Unemployment ▼ | $43,072 | −0.6% | −0.9% | +0.3% | −0.2% | +9.5% |
Jobs report for January 2024: +175K jobs (unemployment 3.7%).
| |||||||||
| 12 Jan 2024 | PPI Dec 2023 | 1.1%month −0.1% | Hotter ▲ | $45,752 | −0.1% | +0.3% | −7.6% | −7.6% | −10.2% |
Producer prices (PPI) for December 2023: 1.1% (month −0.1%).
| |||||||||
| 11 Jan 2024 | CPI Dec 2023 | 3.4%core 3.9% · month +0.2% | Hotter ▲ | $47,203 | −0.3% | +1.5% | −0.6% | −8.1% | −11.5% |
Consumer prices (CPI) for December 2023: 3.4% (core 3.9% · month +0.2%).
| |||||||||
| 5 Jan 2024 | Jobs Dec 2023 | +154K jobsunemployment 3.8% | Unemployment ▲ | $43,945 | 0.0% | −0.4% | 0.0% | −0.4% | −3.0% |
Jobs report for December 2023: +154K jobs (unemployment 3.8%).
| |||||||||
| 13 Dec 2023 | PPI Nov 2023 | 0.8%month +0.1% | Cooler ▼ | $41,352 | +0.2% | 0.0% | +3.5% | +3.8% | +5.3% |
Producer prices (PPI) for November 2023: 0.8% (month +0.1%).
| |||||||||
| 12 Dec 2023 | CPI Nov 2023 | 3.1%core 4.0% · month +0.1% | Cooler ▼ | $41,849 | +0.1% | −0.3% | +0.5% | +4.0% | +2.5% |
Consumer prices (CPI) for November 2023: 3.1% (core 4.0% · month +0.1%).
| |||||||||
| 8 Dec 2023 | Jobs Nov 2023 | +127K jobsunemployment 3.7% | Unemployment ▼ | $43,744 | −0.3% | −0.2% | +2.0% | +1.0% | −3.1% |
Jobs report for November 2023: +127K jobs (unemployment 3.7%).
| |||||||||
| 15 Nov 2023 | PPI Oct 2023 | 1.1%month −0.3% | Cooler ▼ | $36,070 | −0.1% | +0.2% | +6.6% | +1.7% | +5.3% |
Producer prices (PPI) for October 2023: 1.1% (month −0.3%).
| |||||||||
| 14 Nov 2023 | CPI Oct 2023 | 3.2%core 4.0% · month +0.1% | Cooler ▼ | $36,414 | +0.3% | +0.5% | −2.6% | +3.8% | −1.9% |
Consumer prices (CPI) for October 2023: 3.2% (core 4.0% · month +0.1%).
| |||||||||
| 3 Nov 2023 | Jobs Oct 2023 | +159K jobsunemployment 3.9% | Unemployment ▲ | $34,301 | +0.1% | +0.2% | −0.6% | +0.4% | +6.8% |
Jobs report for October 2023: +159K jobs (unemployment 3.9%).
| |||||||||
| 12 Oct 2023 | CPI Sept 2023 | 3.7%core 4.1% · month +0.4% | Unchanged | $26,814 | +0.1% | −0.2% | −0.4% | 0.0% | +6.9% |
Consumer prices (CPI) for September 2023: 3.7% (core 4.1% · month +0.4%).
| |||||||||
| 11 Oct 2023 | PPI Sept 2023 | 1.8%month +0.2% | Cooler ▼ | $27,212 | −0.3% | −0.3% | −1.9% | −2.3% | +3.4% |
Producer prices (PPI) for September 2023: 1.8% (month +0.2%).
| |||||||||
| 6 Oct 2023 | Jobs Sept 2023 | +156K jobsunemployment 3.7% | Unemployment = | $27,697 | −0.6% | −1.1% | +1.9% | +2.0% | −2.0% |
Jobs report for September 2023: +156K jobs (unemployment 3.7%).
| |||||||||
| 14 Sept 2023 | PPI Aug 2023 | 1.9%month +0.7% | Hotter ▲ | $26,413 | 0.0% | +1.0% | +1.2% | +1.5% | +1.3% |
Producer prices (PPI) for August 2023: 1.9% (month +0.7%).
| |||||||||
| 13 Sept 2023 | CPI Aug 2023 | 3.7%core 4.3% · month +0.5% | Hotter ▲ | $26,201 | −0.3% | −0.3% | +1.5% | +2.7% | +5.0% |
Consumer prices (CPI) for August 2023: 3.7% (core 4.3% · month +0.5%).
| |||||||||
| 1 Sept 2023 | Jobs Aug 2023 | +218K jobsunemployment 3.7% | Unemployment ▲ | $26,061 | −0.2% | −0.1% | −0.5% | −0.2% | −0.1% |
Jobs report for August 2023: +218K jobs (unemployment 3.7%).
| |||||||||
| 11 Aug 2023 | PPI Jul 2023 | 1.1%month +0.6% | Hotter ▲ | $29,413 | 0.0% | 0.0% | −0.1% | 0.0% | −11.5% |
Producer prices (PPI) for July 2023: 1.1% (month +0.6%).
| |||||||||
| 10 Aug 2023 | CPI Jul 2023 | 3.2%core 4.7% · month +0.2% | Hotter ▲ | $29,539 | −0.1% | +0.1% | −0.4% | −0.6% | −9.8% |
Consumer prices (CPI) for July 2023: 3.2% (core 4.7% · month +0.2%).
| |||||||||
| 4 Aug 2023 | Jobs Jul 2023 | +163K jobsunemployment 3.5% | Unemployment ▼ | $29,155 | 0.0% | +0.1% | −0.4% | −0.5% | +0.8% |
Jobs report for July 2023: +163K jobs (unemployment 3.5%).
| |||||||||
| 13 Jul 2023 | PPI Jun 2023 | 0.3%month +0.1% | Cooler ▼ | $30,524 | +0.2% | 0.0% | +3.6% | −0.2% | −2.0% |
Producer prices (PPI) for June 2023: 0.3% (month +0.1%).
| |||||||||
| 12 Jul 2023 | CPI Jun 2023 | 3.0%core 4.8% · month +0.2% | Cooler ▼ | $30,804 | −0.1% | −0.5% | −0.7% | +2.8% | −2.3% |
Consumer prices (CPI) for June 2023: 3.0% (core 4.8% · month +0.2%).
| |||||||||
| 7 Jul 2023 | Jobs Jun 2023 | +225K jobsunemployment 3.6% | Unemployment = | $30,118 | +0.1% | +0.6% | +1.4% | +1.3% | +1.4% |
Jobs report for June 2023: +225K jobs (unemployment 3.6%).
| |||||||||
| 14 Jun 2023 | PPI May 2023 | 1.1%month −0.2% | Cooler ▼ | $26,007 | 0.0% | −0.1% | −3.1% | −1.3% | +15.8% |
Producer prices (PPI) for May 2023: 1.1% (month −0.2%).
| |||||||||
| 13 Jun 2023 | CPI May 2023 | 4.0%core 5.3% · month +0.2% | Cooler ▼ | $26,248 | −0.6% | −0.5% | +0.1% | −3.0% | +9.4% |
Consumer prices (CPI) for May 2023: 4.0% (core 5.3% · month +0.2%).
| |||||||||
| 2 Jun 2023 | Jobs May 2023 | +280K jobsunemployment 3.6% | Unemployment ▲ | $27,152 | 0.0% | −0.3% | +1.6% | +1.0% | −1.3% |
Jobs report for May 2023: +280K jobs (unemployment 3.6%).
| |||||||||
| 11 May 2023 | PPI Apr 2023 | 2.3%month +0.1% | Cooler ▼ | $27,554 | −0.7% | −0.7% | −2.2% | −3.0% | −2.9% |
Producer prices (PPI) for April 2023: 2.3% (month +0.1%).
| |||||||||
| 10 May 2023 | CPI Apr 2023 | 4.9%core 5.5% · month +0.3% | Cooler ▼ | $27,727 | +1.0% | +1.4% | −0.1% | −2.4% | −0.9% |
Consumer prices (CPI) for April 2023: 4.9% (core 5.5% · month +0.3%).
| |||||||||
| 5 May 2023 | Jobs Apr 2023 | +241K jobsunemployment 3.4% | Unemployment ▼ | $29,173 | −0.6% | −0.5% | +2.4% | +0.2% | −7.1% |
Jobs report for April 2023: +241K jobs (unemployment 3.4%).
| |||||||||
| 13 Apr 2023 | PPI Mar 2023 | 2.7%month −0.3% | Cooler ▼ | $30,213 | +0.1% | +0.3% | +0.9% | +1.2% | −6.3% |
Producer prices (PPI) for March 2023: 2.7% (month −0.3%).
| |||||||||
| 12 Apr 2023 | CPI Mar 2023 | 5.0%core 5.6% · month +0.1% | Cooler ▼ | $30,028 | +1.0% | +0.6% | −0.3% | +0.5% | −4.7% |
Consumer prices (CPI) for March 2023: 5.0% (core 5.6% · month +0.1%).
| |||||||||
| 7 Apr 2023 | Jobs Mar 2023 | +68K jobsunemployment 3.5% | Unemployment ▼ | $27,931 | 0.0% | −0.2% | −0.4% | −0.3% | +8.7% |
Jobs report for March 2023: +68K jobs (unemployment 3.5%).
| |||||||||
| 15 Mar 2023 | PPI Feb 2023 | 4.7%month 0.0% | Cooler ▼ | $24,775 | −0.1% | +1.3% | −1.5% | +1.2% | +10.3% |
Producer prices (PPI) for February 2023: 4.7% (month 0.0%).
| |||||||||
| 14 Mar 2023 | CPI Feb 2023 | 6.0%core 5.5% · month +0.3% | Cooler ▼ | $24,768 | +3.6% | +5.0% | +2.3% | +0.7% | +16.4% |
Consumer prices (CPI) for February 2023: 6.0% (core 5.5% · month +0.3%).
| |||||||||
| 10 Mar 2023 | Jobs Feb 2023 | +290K jobsunemployment 3.6% | Unemployment ▲ | $19,931 | +1.4% | +0.5% | −0.9% | +1.3% | +34.7% |
Jobs report for February 2023: +290K jobs (unemployment 3.6%).
| |||||||||
| 16 Feb 2023 | PPI Jan 2023 | 5.7%month +0.4% | Cooler ▼ | $24,573 | −0.2% | −0.7% | −2.8% | +1.1% | −1.5% |
Producer prices (PPI) for January 2023: 5.7% (month +0.4%).
| |||||||||
| 14 Feb 2023 | CPI Jan 2023 | 6.4%core 5.6% · month +0.5% | Cooler ▼ | $21,841 | −0.5% | −1.0% | +1.9% | +11.5% | +12.1% |
Consumer prices (CPI) for January 2023: 6.4% (core 5.6% · month +0.5%).
| |||||||||
| 3 Feb 2023 | Jobs Jan 2023 | +434K jobsunemployment 3.5% | Unemployment = | $23,507 | −0.6% | −0.8% | −0.1% | −0.6% | −7.8% |
Jobs report for January 2023: +434K jobs (unemployment 3.5%).
| |||||||||
| 18 Jan 2023 | PPI Dec 2022 | 6.4%month −0.3% | Cooler ▼ | $21,255 | +0.3% | +0.7% | −2.2% | −0.4% | +9.2% |
Producer prices (PPI) for December 2022: 6.4% (month −0.3%).
| |||||||||
| 12 Jan 2023 | CPI Dec 2022 | 6.5%core 5.7% · month 0.0% | Cooler ▼ | $18,092 | +0.3% | +0.3% | +5.2% | +11.0% | +17.5% |
Consumer prices (CPI) for December 2022: 6.5% (core 5.7% · month 0.0%).
| |||||||||
| 6 Jan 2023 | Jobs Dec 2022 | +100K jobsunemployment 3.5% | Unemployment ▼ | $16,679 | +0.6% | +0.4% | +0.7% | +0.7% | +18.3% |
Jobs report for December 2022: +100K jobs (unemployment 3.5%).
| |||||||||
| 13 Dec 2022 | CPI Nov 2022 | 7.1%core 6.0% · month +0.3% | Cooler ▼ | $17,613 | +1.5% | +1.7% | +3.3% | +2.6% | −1.7% |
Consumer prices (CPI) for November 2022: 7.1% (core 6.0% · month +0.3%).
| |||||||||
| 9 Dec 2022 | PPI Nov 2022 | 7.4%month +0.3% | Cooler ▼ | $17,236 | −0.6% | −0.7% | −0.6% | −0.6% | −3.4% |
Producer prices (PPI) for November 2022: 7.4% (month +0.3%).
| |||||||||
| 2 Dec 2022 | Jobs Nov 2022 | +303K jobsunemployment 3.6% | Unemployment = | $17,024 | −0.8% | −0.7% | +0.7% | −0.3% | +1.0% |
Jobs report for November 2022: +303K jobs (unemployment 3.6%).
| |||||||||
| 15 Nov 2022 | PPI Oct 2022 | 8.2%month +0.3% | Cooler ▼ | $16,904 | +0.4% | +0.2% | +1.6% | +0.3% | −2.6% |
Producer prices (PPI) for October 2022: 8.2% (month +0.3%).
| |||||||||
| 10 Nov 2022 | CPI Oct 2022 | 7.7%core 6.3% · month +0.6% | Cooler ▼ | $16,485 | +4.6% | +6.4% | +10.7% | +7.3% | +5.1% |
Consumer prices (CPI) for October 2022: 7.7% (core 6.3% · month +0.6%).
| |||||||||
| 4 Nov 2022 | Jobs Oct 2022 | +357K jobsunemployment 3.6% | Unemployment ▲ | $20,516 | +0.6% | +1.7% | +4.6% | +5.3% | −15.7% |
Jobs report for October 2022: +357K jobs (unemployment 3.6%).
| |||||||||
| 13 Oct 2022 | CPI Sept 2022 | 8.2%core 6.6% · month +0.4% | Cooler ▼ | $18,807 | −2.5% | −2.7% | +1.2% | +0.2% | −0.5% |
Consumer prices (CPI) for September 2022: 8.2% (core 6.6% · month +0.4%).
| |||||||||
| 12 Oct 2022 | PPI Sept 2022 | 8.5%month +0.3% | Cooler ▼ | $19,110 | +0.1% | −0.2% | +0.6% | +1.7% | +0.5% |
Producer prices (PPI) for September 2022: 8.5% (month +0.3%).
| |||||||||
| 7 Oct 2022 | Jobs Sept 2022 | +220K jobsunemployment 3.5% | Unemployment ▼ | $20,021 | −1.2% | −2.0% | −2.0% | −2.7% | −3.9% |
Jobs report for September 2022: +220K jobs (unemployment 3.5%).
| |||||||||
| 14 Sept 2022 | PPI Aug 2022 | 8.7%month −0.1% | Cooler ▼ | $20,214 | +0.5% | +0.6% | −0.3% | −2.9% | −8.6% |
Producer prices (PPI) for August 2022: 8.7% (month −0.1%).
| |||||||||
| 13 Sept 2022 | CPI Aug 2022 | 8.3%core 6.3% · month +0.1% | Cooler ▼ | $22,717 | −4.7% | −6.1% | −9.3% | −9.5% | −15.6% |
Consumer prices (CPI) for August 2022: 8.3% (core 6.3% · month +0.1%).
| |||||||||
| 2 Sept 2022 | Jobs Aug 2022 | +290K jobsunemployment 3.6% | Unemployment ▲ | $20,119 | +0.8% | +1.2% | −0.8% | −1.5% | +6.2% |
Jobs report for August 2022: +290K jobs (unemployment 3.6%).
| |||||||||
| 11 Aug 2022 | PPI Jul 2022 | 9.7%month −0.3% | Cooler ▼ | $24,628 | +0.3% | +0.1% | 0.0% | +1.9% | −3.1% |
Producer prices (PPI) for July 2022: 9.7% (month −0.3%).
| |||||||||
| 10 Aug 2022 | CPI Jul 2022 | 8.5%core 5.9% · month 0.0% | Cooler ▼ | $23,070 | +3.0% | +4.7% | +3.4% | +3.4% | +0.7% |
Consumer prices (CPI) for July 2022: 8.5% (core 5.9% · month 0.0%).
| |||||||||
| 5 Aug 2022 | Jobs Jul 2022 | +714K jobsunemployment 3.5% | Unemployment ▼ | $23,408 | −1.4% | −1.7% | +2.9% | +1.5% | +7.8% |
Jobs report for July 2022: +714K jobs (unemployment 3.5%).
| |||||||||
| 14 Jul 2022 | PPI Jun 2022 | 11.2%month +0.9% | Hotter ▲ | $19,715 | +0.3% | −0.1% | +1.8% | +3.1% | +14.6% |
Producer prices (PPI) for June 2022: 11.2% (month +0.9%).
| |||||||||
| 13 Jul 2022 | CPI Jun 2022 | 9.1%core 5.9% · month +1.3% | Hotter ▲ | $20,034 | −4.5% | −5.1% | +4.6% | +6.4% | +20.2% |
Consumer prices (CPI) for June 2022: 9.1% (core 5.9% · month +1.3%).
| |||||||||
| 8 Jul 2022 | Jobs Jun 2022 | +434K jobsunemployment 3.6% | Unemployment = | $21,604 | −1.5% | −1.1% | +0.4% | −0.2% | −3.7% |
Jobs report for June 2022: +434K jobs (unemployment 3.6%).
| |||||||||
| 14 Jun 2022 | PPI May 2022 | 11.1%month +0.9% | Cooler ▼ | $21,789 | +2.1% | +3.3% | −1.2% | +0.4% | −7.9% |
Producer prices (PPI) for May 2022: 11.1% (month +0.9%).
| |||||||||
| 10 Jun 2022 | CPI May 2022 | 8.6%core 6.0% · month +0.9% | Hotter ▲ | $30,074 | −1.3% | −2.2% | −3.4% | −5.8% | −32.0% |
Consumer prices (CPI) for May 2022: 8.6% (core 6.0% · month +0.9%).
| |||||||||
| 3 Jun 2022 | Jobs May 2022 | +301K jobsunemployment 3.6% | Unemployment ▼ | $29,732 | −0.6% | −0.6% | −2.5% | −2.1% | −4.5% |
Jobs report for May 2022: +301K jobs (unemployment 3.6%).
| |||||||||
| 12 May 2022 | PPI Apr 2022 | 11.2%month +0.5% | Cooler ▼ | $27,832 | +1.6% | +2.3% | +0.4% | +1.2% | +4.8% |
Producer prices (PPI) for April 2022: 11.2% (month +0.5%).
| |||||||||
| 11 May 2022 | CPI Apr 2022 | 8.3%core 6.2% · month +0.3% | Cooler ▼ | $31,539 | −4.2% | −5.5% | −6.7% | −6.4% | −7.4% |
Consumer prices (CPI) for April 2022: 8.3% (core 6.2% · month +0.3%).
| |||||||||
| 6 May 2022 | Jobs Apr 2022 | +308K jobsunemployment 3.7% | Unemployment = | $35,966 | +0.3% | 0.0% | −1.5% | −2.9% | −19.9% |
Jobs report for April 2022: +308K jobs (unemployment 3.7%).
| |||||||||
| 13 Apr 2022 | PPI Mar 2022 | 11.7%month +1.7% | Hotter ▲ | $39,732 | +0.2% | +0.3% | +2.6% | −0.5% | +3.1% |
Producer prices (PPI) for March 2022: 11.7% (month +1.7%).
| |||||||||
| 12 Apr 2022 | CPI Mar 2022 | 8.5%core 6.5% · month +1.1% | Hotter ▲ | $40,324 | +0.5% | +0.6% | +1.5% | +4.2% | +5.0% |
Consumer prices (CPI) for March 2022: 8.5% (core 6.5% · month +1.1%).
| |||||||||
| 1 Apr 2022 | Jobs Mar 2022 | +490K jobsunemployment 3.7% | Unemployment ▼ | $44,876 | +0.7% | +1.2% | +1.6% | +0.7% | −7.1% |
Jobs report for March 2022: +490K jobs (unemployment 3.7%).
| |||||||||
| 15 Mar 2022 | PPI Feb 2022 | 10.4%month +0.9% | Hotter ▲ | $38,732 | +0.3% | +0.2% | −0.8% | +3.7% | +6.8% |
Producer prices (PPI) for February 2022: 10.4% (month +0.9%).
| |||||||||
| 10 Mar 2022 | CPI Feb 2022 | 7.9%core 6.4% · month +0.7% | Hotter ▲ | $39,341 | −1.9% | −0.6% | −6.1% | −7.6% | −2.5% |
Consumer prices (CPI) for February 2022: 7.9% (core 6.4% · month +0.7%).
| |||||||||
| 4 Mar 2022 | Jobs Feb 2022 | +819K jobsunemployment 3.9% | Unemployment ▼ | $41,534 | −0.2% | −0.5% | −7.8% | −7.2% | −8.6% |
Jobs report for February 2022: +819K jobs (unemployment 3.9%).
| |||||||||
| 15 Feb 2022 | PPI Jan 2022 | 10.1%month +1.0% | Hotter ▲ | $44,186 | +0.1% | +0.2% | +4.7% | +3.2% | −10.1% |
Producer prices (PPI) for January 2022: 10.1% (month +1.0%).
| |||||||||
| 10 Feb 2022 | CPI Jan 2022 | 7.5%core 6.0% · month +0.6% | Hotter ▲ | $44,976 | −2.6% | −3.1% | −1.7% | −4.4% | −8.6% |
Consumer prices (CPI) for January 2022: 7.5% (core 6.0% · month +0.6%).
| |||||||||
| 4 Feb 2022 | Jobs Jan 2022 | +190K jobsunemployment 4.0% | Unemployment ▲ | $37,912 | −0.9% | −0.3% | +11.7% | +11.5% | +14.1% |
Jobs report for January 2022: +190K jobs (unemployment 4.0%).
| |||||||||
| 13 Jan 2022 | PPI Dec 2021 | 10.0%month +0.6% | Hotter ▲ | $43,716 | +0.3% | +1.1% | −3.1% | −1.9% | −7.4% |
Producer prices (PPI) for December 2021: 10.0% (month +0.6%).
| |||||||||
| 12 Jan 2022 | CPI Dec 2021 | 7.0%core 5.5% · month +0.7% | Hotter ▲ | $43,403 | +1.4% | +1.0% | +2.8% | −0.3% | −2.3% |
Consumer prices (CPI) for December 2021: 7.0% (core 5.5% · month +0.7%).
| |||||||||
| 7 Jan 2022 | Jobs Dec 2021 | +586K jobsunemployment 3.9% | Unemployment ▼ | $42,285 | −2.0% | −1.0% | −3.7% | −3.3% | −0.1% |
Jobs report for December 2021: +586K jobs (unemployment 3.9%).
| |||||||||
| 14 Dec 2021 | PPI Nov 2021 | 9.9%month +1.1% | Hotter ▲ | $47,400 | −0.7% | −1.0% | −0.3% | +4.6% | +4.7% |
Producer prices (PPI) for November 2021: 9.9% (month +1.1%).
| |||||||||
| 10 Dec 2021 | CPI Nov 2021 | 6.8%core 4.9% · month +0.9% | Hotter ▲ | $48,926 | +1.7% | +1.2% | −0.9% | +3.5% | −3.1% |
Consumer prices (CPI) for November 2021: 6.8% (core 4.9% · month +0.9%).
| |||||||||
| 3 Dec 2021 | Jobs Nov 2021 | +658K jobsunemployment 4.1% | Unemployment ▼ | $56,970 | +0.3% | −0.4% | −5.1% | −12.9% | −16.4% |
Jobs report for November 2021: +658K jobs (unemployment 4.1%).
| |||||||||
| 10 Nov 2021 | CPI Oct 2021 | 6.2%core 4.6% · month +1.0% | Hotter ▲ | $66,379 | +1.8% | +2.9% | −3.0% | −3.0% | −9.9% |
Consumer prices (CPI) for October 2021: 6.2% (core 4.6% · month +1.0%).
| |||||||||
| 9 Nov 2021 | PPI Oct 2021 | 8.9%month +0.6% | Hotter ▲ | $67,749 | +0.1% | +0.1% | −0.9% | −3.8% | −11.0% |
Producer prices (PPI) for October 2021: 8.9% (month +0.6%).
| |||||||||
| 5 Nov 2021 | Jobs Oct 2021 | +801K jobsunemployment 4.5% | Unemployment ▼ | $61,366 | 0.0% | +0.3% | −0.5% | +0.1% | +4.4% |
Jobs report for October 2021: +801K jobs (unemployment 4.5%).
| |||||||||
| 14 Oct 2021 | PPI Sept 2021 | 8.8%month +0.5% | Hotter ▲ | $57,736 | −0.3% | −0.1% | −0.1% | +7.3% | +8.4% |
Producer prices (PPI) for September 2021: 8.8% (month +0.5%).
| |||||||||
| 13 Oct 2021 | CPI Sept 2021 | 5.4%core 4.0% · month +0.5% | Hotter ▲ | $55,080 | −0.3% | 0.0% | +2.4% | +2.3% | +17.8% |
Consumer prices (CPI) for September 2021: 5.4% (core 4.0% · month +0.5%).
| |||||||||
| 8 Oct 2021 | Jobs Sept 2021 | +457K jobsunemployment 4.7% | Unemployment ▼ | $54,891 | +0.1% | −0.1% | +0.3% | +2.2% | +14.5% |
Jobs report for September 2021: +457K jobs (unemployment 4.7%).
| |||||||||
| 14 Sept 2021 | CPI Aug 2021 | 5.3%core 4.0% · month +0.3% | Cooler ▼ | $45,779 | +1.5% | +1.8% | +4.7% | +7.1% | −9.5% |
Consumer prices (CPI) for August 2021: 5.3% (core 4.0% · month +0.3%).
| |||||||||
| 10 Sept 2021 | PPI Aug 2021 | 8.7%month +0.9% | Hotter ▲ | $46,067 | 0.0% | −0.1% | −3.2% | −2.6% | +1.9% |
Producer prices (PPI) for August 2021: 8.7% (month +0.9%).
| |||||||||
| 3 Sept 2021 | Jobs Aug 2021 | +552K jobsunemployment 5.1% | Unemployment ▼ | $50,104 | +1.2% | +1.3% | +1.4% | +1.3% | −9.0% |
Jobs report for August 2021: +552K jobs (unemployment 5.1%).
| |||||||||
| 12 Aug 2021 | PPI Jul 2021 | 8.0%month +1.0% | Hotter ▲ | $44,456 | 0.0% | +0.6% | −2.6% | +4.8% | +2.5% |
Producer prices (PPI) for July 2021: 8.0% (month +1.0%).
| |||||||||
| 11 Aug 2021 | CPI Jul 2021 | 5.4%core 4.3% · month +0.5% | Unchanged | $45,922 | +0.3% | +1.0% | 0.0% | −2.5% | −1.7% |
Consumer prices (CPI) for July 2021: 5.4% (core 4.3% · month +0.5%).
| |||||||||
| 6 Aug 2021 | Jobs Jul 2021 | +942K jobsunemployment 5.4% | Unemployment ▼ | $40,987 | −0.7% | 0.0% | +4.8% | +9.0% | +16.9% |
Jobs report for July 2021: +942K jobs (unemployment 5.4%).
| |||||||||
| 14 Jul 2021 | PPI Jun 2021 | 7.6%month +0.7% | Hotter ▲ | $32,371 | −0.1% | +1.1% | +0.4% | −2.8% | −1.8% |
Producer prices (PPI) for June 2021: 7.6% (month +0.7%).
| |||||||||
| 13 Jul 2021 | CPI Jun 2021 | 5.4%core 4.5% · month +0.8% | Hotter ▲ | $32,883 | −1.2% | −1.0% | −1.4% | −1.0% | −10.1% |
Consumer prices (CPI) for June 2021: 5.4% (core 4.5% · month +0.8%).
| |||||||||
| 2 Jul 2021 | Jobs Jun 2021 | +755K jobsunemployment 5.9% | Unemployment ▲ | $32,929 | +0.7% | +1.3% | +1.0% | +3.3% | +0.7% |
Jobs report for June 2021: +755K jobs (unemployment 5.9%).
| |||||||||
| 15 Jun 2021 | PPI May 2021 | 7.0%month +1.0% | Hotter ▲ | $40,080 | −0.4% | +0.5% | +0.5% | −4.7% | −19.2% |
Producer prices (PPI) for May 2021: 7.0% (month +1.0%).
| |||||||||
| 10 Jun 2021 | CPI May 2021 | 5.0%core 3.8% · month +0.7% | Hotter ▲ | $37,463 | +0.5% | +0.3% | −1.7% | 0.0% | +1.9% |
Consumer prices (CPI) for May 2021: 5.0% (core 3.8% · month +0.7%).
| |||||||||
| 4 Jun 2021 | Jobs May 2021 | +478K jobsunemployment 5.8% | Unemployment ▼ | $35,808 | +2.5% | +2.9% | −5.9% | −9.3% | −4.8% |
Jobs report for May 2021: +478K jobs (unemployment 5.8%).
| |||||||||
| 13 May 2021 | PPI Apr 2021 | 6.5%month +1.0% | Hotter ▲ | $50,285 | −0.4% | −0.6% | +1.1% | +1.5% | −17.0% |
Producer prices (PPI) for April 2021: 6.5% (month +1.0%).
| |||||||||
| 12 May 2021 | CPI Apr 2021 | 4.2%core 3.0% · month +0.6% | Hotter ▲ | $56,690 | −0.4% | −1.3% | −13.3% | −12.3% | −34.7% |
Consumer prices (CPI) for April 2021: 4.2% (core 3.0% · month +0.6%).
| |||||||||
| 7 May 2021 | Jobs Apr 2021 | +355K jobsunemployment 6.1% | Unemployment = | $56,521 | +1.6% | +1.2% | +1.7% | +4.3% | −11.6% |
Jobs report for April 2021: +355K jobs (unemployment 6.1%).
| |||||||||
| 13 Apr 2021 | CPI Mar 2021 | 2.6%core 1.6% · month +0.5% | Hotter ▲ | $63,050 | −0.1% | −0.6% | +6.0% | +5.4% | −5.7% |
Consumer prices (CPI) for March 2021: 2.6% (core 1.6% · month +0.5%).
| |||||||||
| 9 Apr 2021 | PPI Mar 2021 | 4.1%month +0.7% | Hotter ▲ | $58,467 | −0.1% | +0.2% | −0.1% | +2.5% | +5.6% |
Producer prices (PPI) for March 2021: 4.1% (month +0.7%).
| |||||||||
| 2 Apr 2021 | Jobs Mar 2021 | +852K jobsunemployment 6.1% | Unemployment ▼ | $59,391 | +0.1% | −0.1% | +0.5% | −2.5% | −1.4% |
Jobs report for March 2021: +852K jobs (unemployment 6.1%).
| |||||||||
| 12 Mar 2021 | PPI Feb 2021 | 3.0%month +0.7% | Hotter ▲ | $55,273 | +0.7% | +1.3% | −0.8% | +5.9% | +0.9% |
Producer prices (PPI) for February 2021: 3.0% (month +0.7%).
| |||||||||
| 10 Mar 2021 | CPI Feb 2021 | 1.7%core 1.3% · month +0.3% | Hotter ▲ | $55,616 | +0.8% | +0.7% | +2.2% | +5.4% | +7.4% |
Consumer prices (CPI) for February 2021: 1.7% (core 1.3% · month +0.3%).
| |||||||||
| 5 Mar 2021 | Jobs Feb 2021 | +517K jobsunemployment 6.2% | Unemployment ▼ | $48,138 | 0.0% | +0.8% | +0.8% | +0.7% | +18.1% |
Jobs report for February 2021: +517K jobs (unemployment 6.2%).
| |||||||||
| 17 Feb 2021 | PPI Jan 2021 | 1.6%month +1.0% | Hotter ▲ | $50,722 | +0.3% | +0.4% | +6.0% | +5.0% | +1.0% |
Producer prices (PPI) for January 2021: 1.6% (month +1.0%).
| |||||||||
| 10 Feb 2021 | CPI Jan 2021 | 1.4%core 1.4% · month +0.2% | Unchanged | $45,571 | +0.6% | −0.3% | −3.4% | +3.1% | +12.2% |
Consumer prices (CPI) for January 2021: 1.4% (core 1.4% · month +0.2%).
| |||||||||
| 5 Feb 2021 | Jobs Jan 2021 | +315K jobsunemployment 6.4% | Unemployment ▼ | $37,969 | +0.1% | +0.5% | +3.3% | +6.3% | +28.6% |
Jobs report for January 2021: +315K jobs (unemployment 6.4%).
| |||||||||
| 15 Jan 2021 | PPI Dec 2020 | 0.8%month +0.4% | Unchanged | $37,441 | +0.6% | −0.8% | −6.0% | −7.7% | −15.8% |
Producer prices (PPI) for December 2020: 0.8% (month +0.4%).
| |||||||||
| 13 Jan 2021 | CPI Dec 2020 | 1.4%core 1.6% · month +0.4% | Hotter ▲ | $34,507 | +0.3% | +1.1% | +10.0% | +15.5% | +4.8% |
Consumer prices (CPI) for December 2020: 1.4% (core 1.6% · month +0.4%).
| |||||||||
| 8 Jan 2021 | Jobs Dec 2020 | −185K jobsunemployment 6.7% | Unemployment = | $41,382 | +0.2% | −0.3% | +3.6% | +2.2% | −6.5% |
Jobs report for December 2020: −185K jobs (unemployment 6.7%).
| |||||||||
| 11 Dec 2020 | PPI Nov 2020 | 0.8%month +0.1% | Hotter ▲ | $17,863 | 0.0% | +0.6% | −1.1% | +3.0% | +26.7% |
Producer prices (PPI) for November 2020: 0.8% (month +0.1%).
| |||||||||
| 10 Dec 2020 | CPI Nov 2020 | 1.2%core 1.6% · month +0.2% | Unchanged | $18,117 | −0.3% | −0.3% | −1.6% | −2.7% | +22.9% |
Consumer prices (CPI) for November 2020: 1.2% (core 1.6% · month +0.2%).
| |||||||||
| 4 Dec 2020 | Jobs Nov 2020 | +273K jobsunemployment 6.7% | Unemployment ▼ | $18,991 | +0.1% | +0.8% | −3.8% | −1.5% | −7.1% |
Jobs report for November 2020: +273K jobs (unemployment 6.7%).
| |||||||||
| 13 Nov 2020 | PPI Oct 2020 | 0.6%month +0.5% | Hotter ▲ | $16,273 | +0.1% | −0.3% | +0.3% | −1.3% | +14.4% |
Producer prices (PPI) for October 2020: 0.6% (month +0.5%).
| |||||||||
| 12 Nov 2020 | CPI Oct 2020 | 1.2%core 1.6% · month +0.1% | Cooler ▼ | $15,958 | −0.1% | +0.1% | +3.7% | +3.9% | +13.5% |
Consumer prices (CPI) for October 2020: 1.2% (core 1.6% · month +0.1%).
| |||||||||
| 6 Nov 2020 | Jobs Oct 2020 | +690K jobsunemployment 6.9% | Unemployment ▼ | $15,546 | +0.7% | −0.2% | −0.1% | −4.8% | +4.7% |
Jobs report for October 2020: +690K jobs (unemployment 6.9%).
| |||||||||
| 14 Oct 2020 | PPI Sept 2020 | 0.3%month +0.3% | Hotter ▲ | $11,398 | 0.0% | +0.1% | 0.0% | +0.6% | +12.2% |
Producer prices (PPI) for September 2020: 0.3% (month +0.3%).
| |||||||||
| 13 Oct 2020 | CPI Sept 2020 | 1.4%core 1.7% · month +0.3% | Hotter ▲ | $11,487 | 0.0% | −0.5% | −1.1% | −1.1% | +3.1% |
Consumer prices (CPI) for September 2020: 1.4% (core 1.7% · month +0.3%).
| |||||||||
| 2 Oct 2020 | Jobs Sept 2020 | +949K jobsunemployment 7.8% | Unemployment ▼ | $10,490 | −0.2% | −0.3% | −0.4% | −0.7% | +4.2% |
Jobs report for September 2020: +949K jobs (unemployment 7.8%).
| |||||||||
| 11 Sept 2020 | CPI Aug 2020 | 1.3%core 1.7% · month +0.4% | Hotter ▲ | $10,263 | 0.0% | +0.3% | +0.4% | +0.8% | +5.6% |
Consumer prices (CPI) for August 2020: 1.3% (core 1.7% · month +0.4%).
| |||||||||
| 10 Sept 2020 | PPI Aug 2020 | -0.3%month +0.2% | Unchanged | $10,336 | +0.2% | +0.3% | +1.2% | +1.6% | +6.9% |
Producer prices (PPI) for August 2020: -0.3% (month +0.2%).
| |||||||||
| 4 Sept 2020 | Jobs Aug 2020 | +1,566K jobsunemployment 8.4% | Unemployment ▼ | $10,408 | +0.4% | +0.4% | +2.6% | −0.7% | +1.5% |
Jobs report for August 2020: +1,566K jobs (unemployment 8.4%).
| |||||||||
| 12 Aug 2020 | CPI Jul 2020 | 1.0%core 1.6% · month +0.5% | Hotter ▲ | $11,488 | +0.1% | 0.0% | +1.5% | +3.3% | +3.0% |
Consumer prices (CPI) for July 2020: 1.0% (core 1.6% · month +0.5%).
| |||||||||
| 11 Aug 2020 | PPI Jul 2020 | -0.3%month +0.6% | Hotter ▲ | $11,692 | −0.2% | −0.9% | −3.9% | −2.5% | +1.0% |
Producer prices (PPI) for July 2020: -0.3% (month +0.6%).
| |||||||||
| 7 Aug 2020 | Jobs Jul 2020 | +1,584K jobsunemployment 10.2% | Unemployment ▼ | $11,718 | 0.0% | +0.3% | −1.5% | −0.2% | −0.1% |
Jobs report for July 2020: +1,584K jobs (unemployment 10.2%).
| |||||||||
| 14 Jul 2020 | CPI Jun 2020 | 0.6%core 1.2% · month +0.5% | Hotter ▲ | $9,226 | −0.1% | −0.2% | 0.0% | −0.6% | +1.4% |
Consumer prices (CPI) for June 2020: 0.6% (core 1.2% · month +0.5%).
| |||||||||
| 10 Jul 2020 | PPI Jun 2020 | -0.7%month +0.3% | Hotter ▲ | $9,163 | +0.2% | +0.2% | 0.0% | −0.4% | −1.4% |
Producer prices (PPI) for June 2020: -0.7% (month +0.3%).
| |||||||||
| 2 Jul 2020 | Jobs Jun 2020 | +4,631K jobsunemployment 11.0% | Unemployment ▼ | $9,183 | +0.5% | +0.6% | −1.1% | −1.5% | +0.5% |
Jobs report for June 2020: +4,631K jobs (unemployment 11.0%).
| |||||||||
| 11 Jun 2020 | PPI May 2020 | -1.1%month +0.5% | Hotter ▲ | $9,780 | −0.2% | −1.0% | −5.6% | −3.9% | −4.6% |
Producer prices (PPI) for May 2020: -1.1% (month +0.5%).
| |||||||||
| 10 Jun 2020 | CPI May 2020 | 0.1%core 1.2% · month −0.1% | Cooler ▼ | $9,753 | +0.1% | +0.1% | +0.8% | −4.8% | −3.2% |
Consumer prices (CPI) for May 2020: 0.1% (core 1.2% · month −0.1%).
| |||||||||
| 5 Jun 2020 | Jobs May 2020 | +2,614K jobsunemployment 13.2% | Unemployment ▼ | $9,660 | +0.4% | +0.1% | −1.4% | −1.5% | −3.3% |
Jobs report for May 2020: +2,614K jobs (unemployment 13.2%).
| |||||||||
| 13 May 2020 | PPI Apr 2020 | -1.5%month −1.2% | Cooler ▼ | $9,018 | +0.6% | +1.0% | +5.3% | +10.6% | +8.2% |
Producer prices (PPI) for April 2020: -1.5% (month −1.2%).
| |||||||||
| 12 May 2020 | CPI Apr 2020 | 0.3%core 1.4% · month −0.8% | Cooler ▼ | $8,756 | +0.1% | −0.1% | +2.3% | +7.8% | +13.1% |
Consumer prices (CPI) for April 2020: 0.3% (core 1.4% · month −0.8%).
| |||||||||
| 8 May 2020 | Jobs Apr 2020 | −20,469K jobsunemployment 14.8% | Unemployment ▲ | $9,907 | −0.2% | −0.4% | −1.1% | −3.6% | −6.3% |
Jobs report for April 2020: −20,469K jobs (unemployment 14.8%).
| |||||||||
| 10 Apr 2020 | CPI Mar 2020 | 1.5%core 2.1% · month −0.5% | Cooler ▼ | $6,925 | +0.1% | −0.3% | −6.0% | −6.1% | −2.8% |
Consumer prices (CPI) for March 2020: 1.5% (core 2.1% · month −0.5%).
| |||||||||
| 9 Apr 2020 | PPI Mar 2020 | 0.3%month −0.5% | Cooler ▼ | $7,257 | −0.2% | +0.7% | −0.4% | −6.4% | −3.0% |
Producer prices (PPI) for March 2020: 0.3% (month −0.5%).
| |||||||||
| 3 Apr 2020 | Jobs Mar 2020 | −1,398K jobsunemployment 4.4% | Unemployment ▲ | $7,001 | −1.3% | −1.4% | −0.9% | +1.1% | +1.0% |
Jobs report for March 2020: −1,398K jobs (unemployment 4.4%).
| |||||||||
| 12 Mar 2020 | PPI Feb 2020 | 1.1%month −0.5% | Cooler ▼ | $6,099 | −1.7% | −2.0% | −37.2% | −29.7% | −21.7% |
Producer prices (PPI) for February 2020: 1.1% (month −0.5%).
| |||||||||
| 11 Mar 2020 | CPI Feb 2020 | 2.3%core 2.4% · month 0.0% | Cooler ▼ | $7,850 | −0.3% | +0.5% | 0.0% | −37.2% | −33.8% |
Consumer prices (CPI) for February 2020: 2.3% (core 2.4% · month 0.0%).
| |||||||||
| 6 Mar 2020 | Jobs Feb 2020 | +262K jobsunemployment 3.5% | Unemployment ▼ | $9,120 | −0.2% | −0.2% | +0.5% | −1.9% | −38.7% |
Jobs report for February 2020: +262K jobs (unemployment 3.5%).
| |||||||||
| 19 Feb 2020 | PPI Jan 2020 | 2.0%month +0.2% | Hotter ▲ | $10,142 | −0.1% | 0.0% | −5.0% | −5.3% | −13.0% |
Producer prices (PPI) for January 2020: 2.0% (month +0.2%).
| |||||||||
| 13 Feb 2020 | CPI Jan 2020 | 2.5%core 2.3% · month +0.2% | Hotter ▲ | $10,282 | +1.6% | +0.1% | −1.1% | −0.1% | −7.0% |
Consumer prices (CPI) for January 2020: 2.5% (core 2.3% · month +0.2%).
| |||||||||
| 7 Feb 2020 | Jobs Jan 2020 | +237K jobsunemployment 3.6% | Unemployment = | $9,750 | +0.2% | +0.2% | +0.7% | +1.4% | +6.0% |
Jobs report for January 2020: +237K jobs (unemployment 3.6%).
| |||||||||
| 15 Jan 2020 | PPI Dec 2019 | 1.4%month +0.3% | Hotter ▲ | $8,787 | +0.1% | +0.7% | −0.2% | −1.2% | −1.7% |
Producer prices (PPI) for December 2019: 1.4% (month +0.3%).
| |||||||||
| 14 Jan 2020 | CPI Dec 2019 | 2.3%core 2.3% · month +0.3% | Hotter ▲ | $8,534 | +0.1% | +1.8% | +8.4% | +8.1% | +7.4% |
Consumer prices (CPI) for December 2019: 2.3% (core 2.3% · month +0.3%).
| |||||||||
| 10 Jan 2020 | Jobs Dec 2019 | +127K jobsunemployment 3.6% | Unemployment = | $7,916 | 0.0% | 0.0% | +3.7% | +2.0% | +13.3% |
Jobs report for December 2019: +127K jobs (unemployment 3.6%).
| |||||||||
| 12 Dec 2019 | PPI Nov 2019 | 1.0%month −0.2% | Unchanged | $7,183 | −0.1% | −0.2% | +0.4% | +0.7% | −0.2% |
Producer prices (PPI) for November 2019: 1.0% (month −0.2%).
| |||||||||
| 11 Dec 2019 | CPI Nov 2019 | 2.1%core 2.3% · month +0.3% | Hotter ▲ | $7,216 | +0.1% | +0.2% | −0.8% | −0.5% | 0.0% |
Consumer prices (CPI) for November 2019: 2.1% (core 2.3% · month +0.3%).
| |||||||||
| 6 Dec 2019 | Jobs Nov 2019 | +207K jobsunemployment 3.6% | Unemployment = | $7,376 | −0.2% | +0.1% | +1.3% | +1.5% | −2.4% |
Jobs report for November 2019: +207K jobs (unemployment 3.6%).
| |||||||||
| 14 Nov 2019 | PPI Oct 2019 | 1.0%month +0.4% | Cooler ▼ | $8,603 | +0.5% | +0.4% | −1.1% | −3.6% | −13.2% |
Producer prices (PPI) for October 2019: 1.0% (month +0.4%).
| |||||||||
| 13 Nov 2019 | CPI Oct 2019 | 1.8%core 2.3% · month +0.3% | Hotter ▲ | $8,715 | 0.0% | +0.3% | −0.1% | −1.2% | −8.9% |
Consumer prices (CPI) for October 2019: 1.8% (core 2.3% · month +0.3%).
| |||||||||
| 1 Nov 2019 | Jobs Oct 2019 | +95K jobsunemployment 3.6% | Unemployment ▲ | $9,166 | +0.2% | −0.4% | +0.7% | +1.4% | −4.3% |
Jobs report for October 2019: +95K jobs (unemployment 3.6%).
| |||||||||
| 10 Oct 2019 | CPI Sept 2019 | 1.7%core 2.4% · month +0.2% | Unchanged | $8,530 | −0.6% | – | −0.1% | −3.2% | −5.7% |
Consumer prices (CPI) for September 2019: 1.7% (core 2.4% · month +0.2%).
| |||||||||
| 8 Oct 2019 | PPI Sept 2019 | 1.5%month −0.3% | Cooler ▼ | $8,201 | +0.1% | +0.3% | −0.2% | +4.2% | −0.5% |
Producer prices (PPI) for September 2019: 1.5% (month −0.3%).
| |||||||||
| 4 Oct 2019 | Jobs Sept 2019 | +196K jobsunemployment 3.5% | Unemployment ▼ | $8,150 | −0.2% | 0.0% | −0.7% | −1.3% | +0.8% |
Jobs report for September 2019: +196K jobs (unemployment 3.5%).
| |||||||||
| 12 Sept 2019 | CPI Aug 2019 | 1.7%core 2.4% · month +0.1% | Cooler ▼ | $10,193 | −0.1% | +0.6% | +2.3% | +1.8% | +0.9% |
Consumer prices (CPI) for August 2019: 1.7% (core 2.4% · month +0.1%).
| |||||||||
| 11 Sept 2019 | PPI Aug 2019 | 1.9%month +0.1% | Hotter ▲ | $10,044 | +0.3% | −0.2% | +0.6% | +2.9% | +0.8% |
Producer prices (PPI) for August 2019: 1.9% (month +0.1%).
| |||||||||
| 6 Sept 2019 | Jobs Aug 2019 | +232K jobsunemployment 3.6% | Unemployment ▼ | $10,916 | −0.2% | −0.8% | −2.1% | −0.6% | −2.0% |
Jobs report for August 2019: +232K jobs (unemployment 3.6%).
| |||||||||
| 13 Aug 2019 | CPI Jul 2019 | 1.8%core 2.2% · month +0.2% | Hotter ▲ | $11,252 | +0.1% | −0.9% | −4.3% | −11.7% | −5.4% |
Consumer prices (CPI) for July 2019: 1.8% (core 2.2% · month +0.2%).
| |||||||||
| 9 Aug 2019 | PPI Jul 2019 | 1.6%month +0.3% | Unchanged | $11,722 | +0.1% | +0.9% | −0.9% | −5.1% | −13.3% |
Producer prices (PPI) for July 2019: 1.6% (month +0.3%).
| |||||||||
| 2 Aug 2019 | Jobs Jul 2019 | +99K jobsunemployment 3.7% | Unemployment ▲ | $10,520 | 0.0% | +0.2% | +1.1% | +4.1% | +14.1% |
Jobs report for July 2019: +99K jobs (unemployment 3.7%).
| |||||||||
| 12 Jul 2019 | PPI Jun 2019 | 1.6%month −0.1% | Cooler ▼ | $11,656 | +0.1% | +0.7% | +4.0% | +0.3% | −7.3% |
Producer prices (PPI) for June 2019: 1.6% (month −0.1%).
| |||||||||
| 11 Jul 2019 | CPI Jun 2019 | 1.6%core 2.1% · month 0.0% | Cooler ▼ | $11,721 | −0.8% | −0.4% | −6.6% | −2.8% | −12.3% |
Consumer prices (CPI) for June 2019: 1.6% (core 2.1% · month 0.0%).
| |||||||||
| 5 Jul 2019 | Jobs Jun 2019 | +220K jobsunemployment 3.6% | Unemployment = | $11,158 | +0.5% | +0.5% | −2.1% | −0.1% | +5.4% |
Jobs report for June 2019: +220K jobs (unemployment 3.6%).
| |||||||||
| 12 Jun 2019 | CPI May 2019 | 1.8%core 2.0% · month 0.0% | Cooler ▼ | $8,017 | −0.3% | −0.2% | +2.7% | +3.8% | +17.0% |
Consumer prices (CPI) for May 2019: 1.8% (core 2.0% · month 0.0%).
| |||||||||
| 11 Jun 2019 | PPI May 2019 | 2.1%month +0.1% | Cooler ▼ | $7,777 | +0.3% | +0.3% | −0.9% | +1.8% | +13.5% |
Producer prices (PPI) for May 2019: 2.1% (month +0.1%).
| |||||||||
| 7 Jun 2019 | Jobs May 2019 | +27K jobsunemployment 3.6% | Unemployment ▼ | $7,935 | +0.2% | +0.5% | +2.8% | +1.7% | +11.1% |
Jobs report for May 2019: +27K jobs (unemployment 3.6%).
| |||||||||
| 10 May 2019 | CPI Apr 2019 | 2.0%core 2.1% · month +0.4% | Hotter ▲ | $6,265 | +0.4% | +0.3% | +3.3% | +16.7% | +18.9% |
Consumer prices (CPI) for April 2019: 2.0% (core 2.1% · month +0.4%).
| |||||||||
| 9 May 2019 | PPI Apr 2019 | 2.4%month +0.5% | Hotter ▲ | $6,014 | 0.0% | −0.6% | +3.2% | +6.6% | +31.8% |
Producer prices (PPI) for April 2019: 2.4% (month +0.5%).
| |||||||||
| 3 May 2019 | Jobs Apr 2019 | +296K jobsunemployment 3.7% | Unemployment ▼ | $5,736 | −0.2% | +0.3% | +4.8% | +5.9% | +15.9% |
Jobs report for April 2019: +296K jobs (unemployment 3.7%).
| |||||||||
| 11 Apr 2019 | PPI Mar 2019 | 2.0%month +0.3% | Hotter ▲ | $5,033 | – | – | −4.9% | −4.4% | −0.5% |
Producer prices (PPI) for March 2019: 2.0% (month +0.3%).
| |||||||||
| 10 Apr 2019 | CPI Mar 2019 | 1.9%core 2.0% · month +0.4% | Hotter ▲ | $5,253 | +0.5% | +0.4% | +2.3% | −2.7% | +0.9% |
Consumer prices (CPI) for March 2019: 1.9% (core 2.0% · month +0.4%).
| |||||||||
| 5 Apr 2019 | Jobs Mar 2019 | +228K jobsunemployment 3.8% | Unemployment = | $4,997 | +0.6% | +0.9% | +2.3% | +2.8% | +3.4% |
Jobs report for March 2019: +228K jobs (unemployment 3.8%).
| |||||||||
| 13 Mar 2019 | PPI Feb 2019 | 1.9%month +0.2% | Unchanged | $3,840 | +0.2% | +0.6% | −0.1% | +0.4% | +4.6% |
Producer prices (PPI) for February 2019: 1.9% (month +0.2%).
| |||||||||
| 12 Mar 2019 | CPI Feb 2019 | 1.5%core 2.1% · month +0.3% | Cooler ▼ | $3,866 | +0.1% | 0.0% | +0.1% | +0.1% | +4.3% |
Consumer prices (CPI) for February 2019: 1.5% (core 2.1% · month +0.3%).
| |||||||||
| 8 Mar 2019 | Jobs Feb 2019 | +7K jobsunemployment 3.8% | Unemployment ▼ | $3,879 | +0.1% | +0.2% | −0.3% | +1.3% | +1.3% |
Jobs report for February 2019: +7K jobs (unemployment 3.8%).
| |||||||||
| 14 Feb 2019 | PPI Jan 2019 | 1.9%month −0.3% | – | $3,562 | 0.0% | −0.1% | −0.4% | −0.3% | +8.9% |
Producer prices (PPI) for January 2019: 1.9% (month −0.3%).
| |||||||||
| 13 Feb 2019 | CPI Jan 2019 | 1.6%core 2.2% · month −0.1% | – | $3,584 | −0.1% | −0.3% | −0.6% | −1.0% | +9.5% |
Consumer prices (CPI) for January 2019: 1.6% (core 2.2% · month −0.1%).
| |||||||||
| 1 Feb 2019 | Jobs Jan 2019 | +251K jobsunemployment 4.0% | Unemployment ▲ | $3,429 | +0.2% | +0.2% | +0.9% | +1.8% | +6.0% |
Jobs report for January 2019: +251K jobs (unemployment 4.0%).
| |||||||||
Figures are today’s values from the Bureau of Labor Statistics, so they include later revisions (jobs numbers especially can differ from what was announced on the day). October 2025 has no reports: the government shutdown stopped the data collection. CPI’s monthly change for November 2025 is missing for the same reason.
The reports
- CPI (Consumer Price Index): how much prices rose for shoppers over the last 12 months. “Core” leaves out food and energy, which jump around. The Fed watches it to decide rates.
- Jobs report (Employment Situation): how many jobs the US economy added (“nonfarm payrolls”) and the unemployment rate. Out on the first Friday of most months.
- PPI (Producer Price Index): prices businesses get for what they sell. It often shows inflation before it reaches shoppers.
- FOMC: the Fed’s rate decision, eight times a year. See FOMC & Crypto.
Why crypto cares
Higher inflation or a very strong jobs market means the Fed is more likely to keep rates high or raise them, which makes money more expensive and usually hurts risky assets like crypto. Cooler inflation or a weaker job market points the other way. That’s why Bitcoin often jumps within minutes of 8:30 am New York time.
What really moves prices is the surprise against economists’ forecasts, and the same report can be read both ways. A few hundred reports is a small sample and other news often lands the same day. These are patterns from the past, not predictions. Not financial advice. See also the Fear & Greed Index.
Frequently asked questions
Which US reports move crypto?
Inflation, jobs and the Fed's rate decisions. Since 2019, the biggest release-day moves in Bitcoin came with Fed rate decisions.
What time do US inflation and jobs reports come out?
Inflation and jobs reports come out at 8:30 am New York time. Fed decisions come at 2:00 pm.
Why does inflation data move Bitcoin?
Higher inflation means the Fed is more likely to keep rates high or raise them, which makes money more expensive and usually hurts risky assets. Cooler inflation points the other way.
What is the difference between CPI and PPI?
CPI measures how much prices rose for shoppers. PPI measures prices businesses get for what they sell, and it often shows inflation before it reaches shoppers.
Does a strong jobs report help Bitcoin?
Not necessarily. A very strong jobs market makes the Fed more likely to keep rates high or raise them. What really moves prices is the surprise against economists' forecasts.
Release dates: Bureau of Labor Statistics (archives and schedules). Figures: BLS public data API. Fed decisions: Federal Reserve. Bitcoin: Coinbase (15-minute, BTC-USD) and CoinMarketCap (daily close). Updated when the site is rebuilt, several times a day.