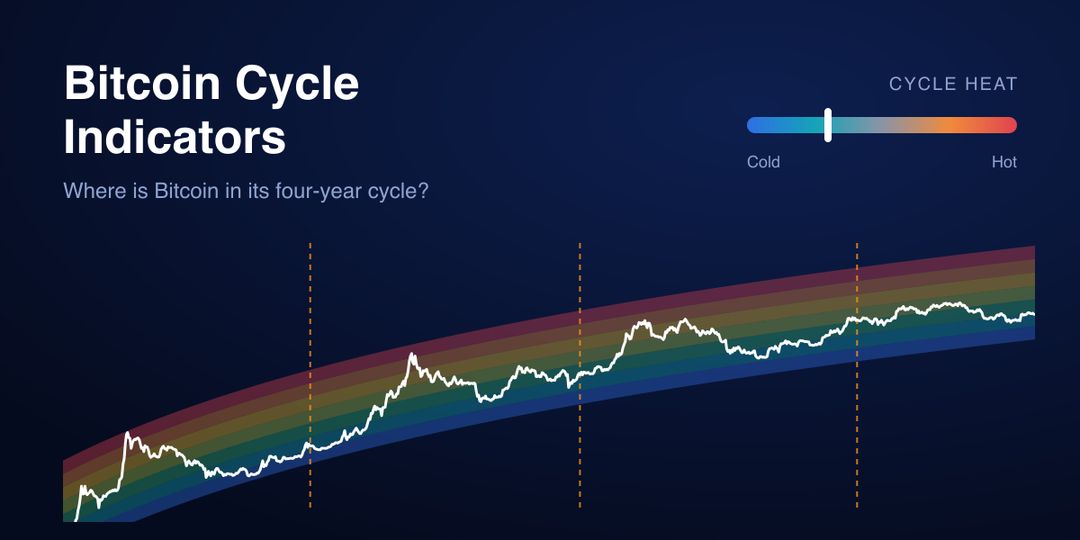
Bitcoin has moved in four-year cycles tied to its halving: a rally, a peak 12–18 months after the halving, then a deep fall and a bottom about a year later. These indicators show where we are in that pattern today, and how each one looked at past tops and bottoms.
Cycle heat
29Cool
Cold bottomstops Hot
The five indicators below are, on average, hotter than 29% of all days since 2013. Bear-market bottoms scored 5–9; the peaks scored 99 (2017), 81 (2021), 64 (2025).
Bitcoin$75,748−39.3% from the 6 Oct 2025 peak
Days since the peak397Past bottoms: 364–406 days after the peak
Next halving517 days≈ 9 Apr 2028 · 74,895 blocks left
Cycle progressDay 931of ~1,460 since the April 2024 halving
Updated 7 Nov 2026, with each publish of the site. Prices: CoinMarketCap; block height: mempool.space.
The indicators today
2-Year MA Multiplier
Cool
0.85×
Price ÷ its 2-year average.
Hotter than 24% of past days
At tops
—9.86×2.61×
At bottoms
0.49×0.57×0.41×
Below 1× (under the 2-year average) has been the best zone to buy in every cycle. The 2017 top reached almost 10×; 2021 only 2.6×.
200-week moving average
Cold
1.12×
Price ÷ its average over the last 200 weeks (about 4 years, one full cycle).
Hotter than 16% of past days
At tops
—16.13×3.96×
At bottoms
—1.02×0.66×
The long-term floor. The 2018 bottom landed right on it; in 2022 the price fell a third below it for a few months.
Mayer Multiple
Neutral
1.03×
Price ÷ its 200-day average.
Hotter than 43% of past days
At tops
5.64×3.74×1.48×
At bottoms
0.41×0.51×0.71×
Above about 2.4× the market has been overheated; below 0.8× it has been deep value. Bottoms came near 0.4–0.7×.
Pi Cycle Top
Cool
50%
The 111-day average ÷ twice the 350-day average. It fires at 100%.
Hotter than 35% of past days
At tops
—100%57%
At bottoms
35%38%32%
It fired on 16 Dec 2017 and 11 Apr 2021 (the 2017 top and the first 2021 peak). It did not fire in 2025: the last top was never that heated.
Power-law corridor
Cool
25%
Where the price sits between the lowest (0%) and highest (100%) it has ever been against its long-term trend.
Hotter than 25% of past days
At tops
100%91%72%
At bottoms
14%22%18%
On a log–log chart Bitcoin has followed one rising line since 2013. Trend value today: $122K; at the next halving: $182K.
How to read the cards
“Hotter than” compares today with every day since the indicator starts (2013 for most; the 200-week average needs four years of prices, so from late 2016).
“At tops / bottoms” shows the reading at the 2013, 2017, 2021 peaks and the 2015, 2018, 2022 lows, in that order (— where our data doesn’t reach).
Cold 0–20
Cool 20–40
Neutral 40–60
Warm 60–80
Hot 80–100
Bitcoin’s price with each indicator
Bitcoin’s price with its long-term trend split into seven bands, from deep value (blue) to bubble (red). Each band is the same width on a log scale; prices since 2013 have stayed between the outer edges. Dashed lines are halvings; dots mark cycle tops (red) and bottoms (blue).
The orange line is the 200-week moving average, the long-term floor. Bear-market lows have come close to it. Dashed lines are halvings; dots mark cycle tops (red) and bottoms (blue).
Below the green line (the 2-year average) has been the cheapest zone of each cycle; the red line is 5× the average, which the price went past at the 2017 top. Dashed lines are halvings; dots mark cycle tops (red) and bottoms (blue).
When the teal line (111-day average) crosses above the red one (twice the 350-day average), the indicator fires. Red rings mark each signal. Dashed lines are halvings; dots mark cycle tops (red) and bottoms (blue).
Price ÷ the 200-day average. The blue band (below 0.8×) has been deep value; the red band (above 2.4×) overheated. Dashed lines are halvings.
The average of the five indicators’ percentiles, day by day, next to the price (grey). Every bear-market bottom sat in the blue band (20 or less); the 2017 and 2021 tops reached the red band (80+), the 2025 peak only 64. Dashed lines are halvings.
The four cycles side by side
Each line is one cycle, lined up on the same starting point. The orange line is the cycle we are in now.
Change from each cycle’s peak, day by day. Past bottoms came 406, 364, 378 days after the peak.
Price as a multiple of the price on halving day (log scale). The 2012 line starts in January 2013, where our daily prices begin.
Price as a multiple of each bear-market low (log scale), for about four years after it.
Every cycle since 2012
Halving
Price then
Peak
Days after halving
Peak vs halving
Bottom
Fall
Days after peak
20 Apr 2024
$64,994
6 Oct 2025 $124,753 so far
534
1.9×
30 Jun 2026 $58,559 lowest so far
−53.1%
267
11 May 2020
$8,602
8 Nov 2021 $67,567
546
7.9×
21 Nov 2022 $15,787
−76.6%
378
9 Jul 2016
$651
16 Dec 2017 $19,497
525
29.9×
15 Dec 2018 $3,237
−83.4%
364
28 Nov 2012
$12
4 Dec 2013 $1,151
371
93.2×
14 Jan 2015 $178
−84.5%
406
Every cycle has been gentler: the peak was 93×, 30×, 8×, 2× the halving-day price, and the falls got smaller. Peaks came 371, 525, 546, 534 days after the halving.
How it’s calculated
All indicators use Bitcoin’s daily closing price since 1 Jan 2013 (CoinMarketCap). Moving averages are simple averages of the last 111, 200, 350, 730 or 1,400 days.
The power-law trend is a straight line fitted through log(price) against log(days since Bitcoin’s first block), using every day since 2013.
Cycle heat is the average of the five indicators’ percentiles: 0 would mean every indicator is at its coldest ever, 100 its hottest.
A cycle starts at a halving. Its peak is the highest close in the next two years; its bottom the lowest close in the 18 months after the peak.
The halving date is estimated from the current block height and the average block time since April 2024.
How to use it
These indicators describe the past well, but there have only been four cycles, and each one was different. Read them together, as context: when most of them are cold, fear is usually high and prices low compared with the trend; when most are hot, FOMO is in charge.
On 7 Nov 2026, 931 days after the April 2024 halving and 397 days after the 6 Oct 2025 peak of $124,753. Bitcoin is 39% below that peak. Cycle heat is 29/100 (Cool): cooler than most days since 2013.
When is the next Bitcoin halving?
At block 1,050,000, expected around 9 Apr 2028 at the current pace of one block every 9.9 minutes. The block reward will drop from 3.125 to 1.5625 BTC.
Has the Bitcoin bear market bottomed?
Nobody can know in advance. In the last three cycles the bottom came 406, 364, 378 days after the top, after falls of 85%, 83%, 77%. This cycle's lowest close so far is $58,559 on 30 Jun 2026, 53% below the peak.
Do these indicators still work?
Each one called past tops or bottoms well, but every cycle has been milder than the one before: smaller gains, smaller falls, and some top signals (like the Pi Cycle) never fired in 2025. ETFs and big institutions may be changing the pattern. Use them as context, not as a timer.
Data: CoinMarketCap (Bitcoin’s daily prices) and mempool.space (block height). Calculations: Cryptensive. Not financial advice.