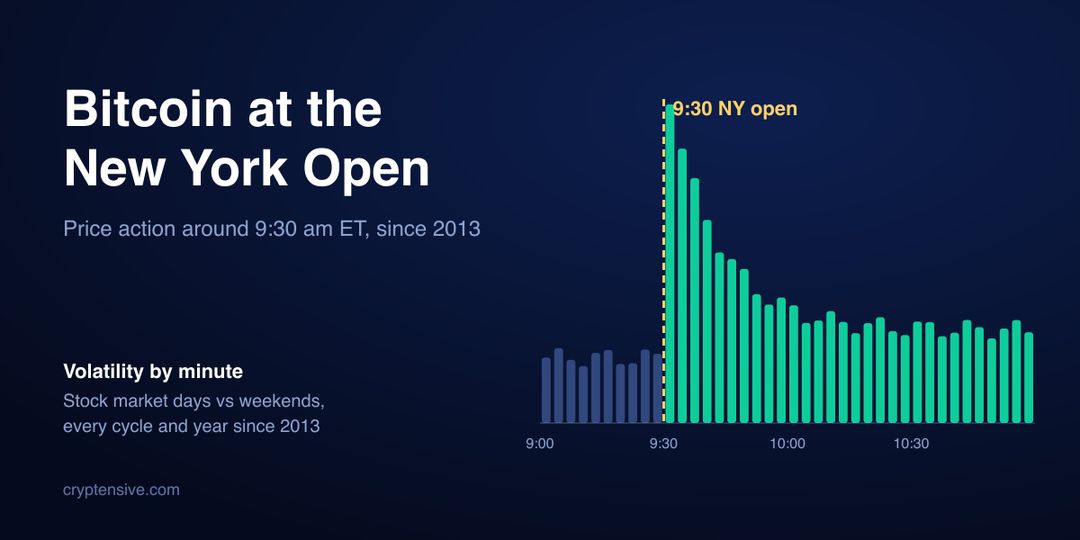
Bitcoin at the New York Open
What Bitcoin does around 9:30 am New York time, when the US stock market opens: every trading day since 2013, minute by minute. Weekends at the same time are the comparison: the stock market is closed then, so any difference is the open itself. Tick the halving cycles and years you want; every number below follows your choice.
3,486 stock market days and 1,446 weekend days (2 Jan 2013 to 10 Nov 2026)
The average path around the open
Price change from 9:29 ET, from 9:00 to 14:00 ET. The line is the average, the dashed line the median, the shaded band the middle half of days (25th to 75th percentile).
When Bitcoin moves: volatility and volume by minute
Average size of each 1-minute candle (|close − open|), and volume per minute compared with the day’s average minute (1.0 = average). Blue: stock market days. Grey: weekends, same clock time.
What the data says
- The open matters, but only in recent years. Moves per minute jump 1.2× at 9:30 and volume 1.4×. On weekends, at the same clock time, the jump is 1.0×, so it is the stock market, not the time of day. The 30 minutes after the open travel 0.99% from high to low on average, against 0.81% in the 30 minutes before. The busiest minute is 10:00 ET. It is a recent change: in the chosen years from 2022 the jump is 1.9×, before 2022 only 1.0× (see Year by year).
- The first 30 minutes often set the morning’s extreme. On 57% of days the high or the low of 9:30–13:30 came in the first 30 minutes, and on 41% in the first 15. The least likely half hours for an extreme were 11:30–12:00 and 12:30–13:00 ET.
- Does the first move last? After an up first half hour, Bitcoin was still above its 9:29 price at 13:30 on 67% of days; after a down one, still below on 62%. From 10:00 on, it kept going the same way 51% (up) and 47% (down) of the time. So the first move is usually kept, not extended: after 10:00 the direction is close to a coin flip.
- Overnight move vs the open. When Bitcoin rose between the daily open (00:00 GMT) and 9:29, the first 30 minutes fell on 49% of days; after a fall, they rose on 51%. No strong reversal pattern.
- Event days are not much busier after the open. On days with a CPI, jobs, PPI or Fed event (331 in the chosen period, from 2019), the first hour moved 0.66% on average (up or down), against 0.66% on days without one. CPI, jobs and PPI come out at 8:30, an hour before the open: from the daily open to 9:29 Bitcoin moved 1.63% on those days, against 1.65% on quiet days. The Fed decides at 2:00 pm, after the 4-hour window.
- By weekday. The first hour moved most on Fridays (0.72% on average, up or down) and least on Thursdays (0.64%). Weekends at the same time move 0.39% in an hour.
Averages and deviations, by part of the day
| Part of the day | From → to | Days | Average | Median | Up days | Avg. size (±) | Std. dev. | Best | Worst |
|---|---|---|---|---|---|---|---|---|---|
| Before the open | Daily open (00:00 GMT) → 9:29 ET | 3486 | +0.20% | +0.10% | 52% | 1.93% | 3.19% | +32.65% | −27.14% |
| First 30 minutes | 9:29 → 10:00 ET | 3486 | +0.01% | 0.00% | 50% | 0.49% | 0.84% | +11.81% | −12.46% |
| First hour | 9:29 → 10:30 ET | 3486 | +0.05% | +0.02% | 52% | 0.67% | 1.10% | +14.01% | −11.53% |
| First 4 hours | 9:29 → 13:30 ET | 3486 | +0.04% | +0.05% | 53% | 1.23% | 2.11% | +21.43% | −33.64% |
| Rest of the day | 13:30 ET → daily close | 3486 | +0.05% | +0.04% | 52% | 1.19% | 2.26% | +66.49% | −21.27% |
| Whole day | Daily open → daily close | 3486 | +0.30% | +0.13% | 52% | 2.76% | 4.38% | +39.93% | −48.52% |
“Avg. size (±)” is the average move ignoring direction: how far Bitcoin usually travels. The standard deviation is the usual spread around the average; about two days in three fall within one standard deviation.
Event days, weekdays and weekends compared
| Days | Count | First 30 min avg. | Up | First hour size (±) | High–low 9:30–10:00 | First 4 h avg. | Up | Std. dev. 4 h |
|---|---|---|---|---|---|---|---|---|
| All stock market days | 3486 | +0.01% | 50% | 0.67% | 0.99% | +0.04% | 53% | 2.11% |
| Event days | 331 | +0.01% | 51% | 0.66% | 0.98% | −0.02% | 51% | 1.60% |
| No event | 1645 | 0.00% | 48% | 0.66% | 0.98% | +0.01% | 50% | 1.90% |
| CPI days | 92 | +0.10% | 49% | 0.74% | 1.12% | +0.04% | 50% | 1.68% |
| Jobs days | 90 | −0.02% | 58% | 0.73% | 0.97% | −0.09% | 52% | 1.70% |
| PPI days | 92 | −0.04% | 49% | 0.59% | 0.97% | −0.14% | 45% | 1.67% |
| FOMC days | 63 | −0.04% | 48% | 0.53% | 0.74% | +0.19% | 57% | 1.13% |
| Mondays | 654 | +0.10% | 56% | 0.67% | 0.99% | +0.15% | 52% | 1.94% |
| Tuesdays | 719 | −0.04% | 45% | 0.68% | 0.96% | +0.09% | 51% | 1.90% |
| Wednesdays | 714 | −0.01% | 49% | 0.64% | 0.97% | 0.00% | 54% | 2.32% |
| Thursdays | 701 | −0.03% | 51% | 0.64% | 0.99% | −0.08% | 53% | 2.35% |
| Fridays | 698 | +0.07% | 53% | 0.72% | 1.03% | +0.08% | 52% | 1.97% |
| Weekends (control) | 1446 | −0.02% | 50% | 0.39% | 0.61% | +0.06% | 54% | 1.30% |
Event days (US inflation and jobs reports, Fed decisions) are counted from 2019, the start of our Macro Calendar; “No event” covers the same years. Groups of a few dozen days can be swung by one big day.
When the morning’s high and low happen
Share of days the highest and the lowest price of 9:30–13:30 ET fell in each half hour. If timing were random, each bar would be about 12.5%.
High of the morning Low of the morning
Year by year
Has Wall Street made the open matter more? Each year on its own, whatever is ticked above.
| Year | Days | Moves jump at 9:30 | Volume jump | First 30 min size (±) | Extreme in first 30 min | First 4 h avg. | Up |
|---|---|---|---|---|---|---|---|
| 2013 | 252 | 1.0× | 1.1× | 0.79% | 52% | +0.23% | 60% |
| 2014 | 252 | 1.0× | 1.0× | 0.50% | 53% | +0.32% | 61% |
| 2015 | 252 | 1.0× | 0.9× | 0.33% | 59% | +0.16% | 60% |
| 2016 | 252 | 1.0× | 1.0× | 0.19% | 50% | −0.08% | 47% |
| 2017 | 251 | 1.0× | 1.0× | 0.58% | 55% | +0.09% | 61% |
| 2018 | 251 | 1.0× | 1.0× | 0.46% | 49% | −0.14% | 48% |
| 2019 | 252 | 1.0× | 1.0× | 0.29% | 47% | +0.15% | 54% |
| 2020 | 253 | 1.1× | 1.1× | 0.46% | 57% | +0.19% | 54% |
| 2021 | 252 | 1.0× | 1.3× | 0.65% | 55% | −0.08% | 49% |
| 2022 | 251 | 1.8× | 2.0× | 0.58% | 68% | −0.16% | 44% |
| 2023 | 250 | 1.5× | 1.5× | 0.32% | 58% | −0.05% | 46% |
| 2024 | 252 | 1.8× | 2.1× | 0.59% | 68% | +0.04% | 53% |
| 2025 | 250 | 2.2× | 2.8× | 0.53% | 65% | −0.08% | 51% |
| 2026 | 216 | 2.1× | 2.5× | 0.52% | 63% | +0.04% | 50% |
Every trading day
Bitstamp BTC/USD. Daily candle = 00:00 to 24:00 GMT; the open is at 14:30 GMT in winter and 13:30 GMT in summer. Small numbers: under 9:29, the change from the daily open; under 10:00, 10:30 and 13:30, the change from 9:29; under the close, the whole day’s change.
| Date | Events | Daily open | 9:29 ET | 10:00 ET +30 min | 10:30 ET +1 hour | 13:30 ET +4 hours | High / low 9:30–13:30 | Daily close |
|---|---|---|---|---|---|---|---|---|
| Average (median below) | +0.20%+0.10% | +0.01%0.00% | +0.05%+0.02% | +0.04%+0.05% | +0.30%+0.13% | |||
| Tue 10 Nov 2026 | CPI | $75,255 | $73,682−2.09% | $74,306+0.85% | $73,993+0.42% | $73,252−0.58% | $74,740 10:02$72,677 11:37 | $73,698−2.07% |
| Mon 9 Nov 2026 | $74,761 | $74,584−0.24% | $74,796+0.28% | $75,015+0.58% | $74,469−0.15% | $75,462 10:46$74,257 9:40 | $75,267+0.68% | |
| Fri 6 Nov 2026 | Jobs | $75,983 | $75,508−0.62% | $75,435−0.10% | $75,513+0.01% | $75,753+0.32% | $76,041 9:51$74,762 10:05 | $75,747−0.31% |
| Thu 5 Nov 2026 | $80,423 | $79,416−1.25% | $78,203−1.53% | $76,337−3.88% | $76,020−4.28% | $79,514 9:30$75,463 10:54 | $75,971−5.54% | |
| Wed 4 Nov 2026 | $77,343 | $78,218+1.13% | $79,239+1.31% | $80,549+2.98% | $80,523+2.95% | $81,105 10:17$78,210 9:30 | $80,434+4.00% | |
| Tue 3 Nov 2026 | $76,674 | $77,037+0.47% | $77,254+0.28% | $77,238+0.26% | $77,578+0.70% | $77,727 13:10$77,002 9:30 | $77,345+0.87% | |
| Mon 2 Nov 2026 | $78,241 | $77,664−0.74% | $77,739+0.10% | $77,805+0.18% | $76,838−1.06% | $78,022 9:35$76,738 12:46 | $76,674−2.00% | |
| Fri 30 Oct 2026 | $77,785 | $77,159−0.81% | $76,991−0.22% | $76,718−0.57% | $77,191+0.04% | $77,937 11:18$76,451 9:52 | $77,187−0.77% | |
| Thu 29 Oct 2026 | $81,250 | $80,124−1.39% | $80,191+0.08% | $80,324+0.25% | $80,997+1.09% | $81,888 12:09$79,806 9:39 | $77,793−4.26% | |
| Wed 28 Oct 2026 | FOMC | $80,811 | $80,531−0.35% | $80,611+0.10% | $80,434−0.12% | $80,453−0.10% | $80,794 9:36$80,297 9:48 | $81,250+0.54% |
| Tue 27 Oct 2026 | $80,006 | $79,995−0.01% | $79,864−0.16% | $80,154+0.20% | $80,644+0.81% | $80,715 13:27$79,764 10:02 | $80,811+1.01% | |
| Mon 26 Oct 2026 | $80,048 | $79,778−0.34% | $79,571−0.26% | $79,708−0.09% | $80,225+0.56% | $80,697 11:21$79,345 9:36 | $80,006−0.05% | |
| Fri 23 Oct 2026 | $81,303 | $81,658+0.44% | $81,891+0.28% | $81,350−0.38% | $81,532−0.16% | $81,941 10:01$80,988 10:17 | $81,076−0.28% | |
| Thu 22 Oct 2026 | $84,023 | $81,772−2.68% | $81,609−0.20% | $81,602−0.21% | $81,293−0.59% | $81,982 9:34$80,836 12:53 | $81,315−3.22% | |
| Wed 21 Oct 2026 | $82,946 | $83,662+0.86% | $83,727+0.08% | $83,805+0.17% | $84,502+1.00% | $84,843 12:39$83,179 9:37 | $84,023+1.30% | |
| Tue 20 Oct 2026 | $81,840 | $81,318−0.64% | $82,027+0.87% | $82,880+1.92% | $82,660+1.65% | $83,335 10:57$81,212 9:34 | $82,946+1.35% | |
| Mon 19 Oct 2026 | $82,002 | $82,447+0.54% | $82,030−0.51% | $82,035−0.50% | $81,893−0.67% | $82,437 11:25$81,650 12:03 | $81,840−0.20% | |
| Fri 16 Oct 2026 | $82,131 | $81,883−0.30% | $81,921+0.05% | $82,225+0.42% | $80,795−1.33% | $82,377 10:24$80,714 13:26 | $81,501−0.77% | |
| Thu 15 Oct 2026 | PPI | $81,577 | $80,190−1.70% | $80,107−0.10% | $81,069+1.10% | $82,295+2.62% | $82,546 13:17$79,694 9:55 | $82,131+0.68% |
| Wed 14 Oct 2026 | CPI | $83,094 | $82,513−0.70% | $82,259−0.31% | $81,966−0.66% | $81,800−0.86% | $83,012 9:48$81,500 12:19 | $81,574−1.83% |
| Tue 13 Oct 2026 | $81,746 | $83,314+1.92% | $83,165−0.18% | $83,545+0.28% | $83,139−0.21% | $83,739 10:12$83,062 13:11 | $83,094+1.65% | |
| Mon 12 Oct 2026 | $83,679 | $82,495−1.41% | $82,882+0.47% | $82,884+0.47% | $82,349−0.18% | $83,022 10:11$82,318 10:49 | $81,746−2.31% | |
| Fri 9 Oct 2026 | $81,676 | $82,885+1.48% | $82,560−0.39% | $83,091+0.25% | $82,603−0.34% | $83,222 10:34$82,400 10:02 | $82,562+1.08% | |
| Thu 8 Oct 2026 | $83,275 | $82,366−1.09% | $82,108−0.31% | $82,664+0.36% | $80,671−2.06% | $82,714 10:34$80,308 13:26 | $81,676−1.92% | |
| Wed 7 Oct 2026 | $85,544 | $83,257−2.67% | $83,153−0.12% | $83,030−0.27% | $83,172−0.10% | $83,652 12:33$82,734 9:48 | $83,275−2.65% | |
| Tue 6 Oct 2026 | $85,756 | $86,010+0.30% | $86,306+0.34% | $86,016+0.01% | $85,627−0.45% | $86,677 11:01$85,480 13:20 | $85,554−0.24% | |
| Mon 5 Oct 2026 | $86,490 | $86,079−0.48% | $86,400+0.37% | $86,264+0.22% | $85,366−0.83% | $86,697 10:16$84,973 12:23 | $85,756−0.85% | |
| Fri 2 Oct 2026 | Jobs | $84,851 | $86,627+2.09% | $86,568−0.07% | $86,082−0.63% | $84,591−2.35% | $87,144 9:37$84,600 13:29 | $84,501−0.41% |
| Thu 1 Oct 2026 | $83,555 | $83,477−0.09% | $83,918+0.53% | $84,082+0.73% | $84,876+1.68% | $84,876 13:28$83,442 9:32 | $84,853+1.55% | |
| Wed 30 Sept 2026 | $83,637 | $85,141+1.80% | $84,606−0.63% | $83,720−1.67% | $84,163−1.15% | $85,510 9:32$83,337 10:33 | $83,563−0.09% | |
| Tue 29 Sept 2026 | $83,466 | $84,338+1.04% | $84,183−0.18% | $83,924−0.49% | $83,155−1.40% | $84,429 9:56$82,870 12:56 | $83,629+0.20% | |
| Mon 28 Sept 2026 | $84,455 | $83,498−1.13% | $83,626+0.15% | $83,229−0.32% | $83,868+0.44% | $84,338 13:16$82,555 10:53 | $83,462−1.18% | |
| Fri 25 Sept 2026 | $84,383 | $84,180−0.24% | $83,902−0.33% | $83,661−0.62% | $83,647−0.63% | $84,297 9:36$83,161 10:05 | $84,090−0.35% | |
| Thu 24 Sept 2026 | $84,394 | $83,784−0.72% | $84,238+0.54% | $84,845+1.27% | $84,308+0.63% | $84,900 10:29$83,372 10:53 | $84,383−0.01% | |
| Wed 23 Sept 2026 | $86,201 | $85,530−0.78% | $85,779+0.29% | $84,019−1.77% | $84,041−1.74% | $85,911 10:01$83,508 12:02 | $84,385−2.11% | |
| Tue 22 Sept 2026 | $86,587 | $85,776−0.94% | $86,319+0.63% | $85,912+0.16% | $86,596+0.96% | $86,700 11:46$85,479 10:35 | $86,201−0.44% | |
| Mon 21 Sept 2026 | $81,152 | $84,964+4.70% | $85,431+0.55% | $85,693+0.86% | $85,879+1.08% | $86,332 11:13$84,750 9:38 | $86,587+6.70% | |
| Fri 18 Sept 2026 | $76,355 | $78,115+2.31% | $80,015+2.43% | $80,675+3.28% | $80,723+3.34% | $81,238 12:34$78,070 9:30 | $80,879+5.92% | |
| Thu 17 Sept 2026 | $76,139 | $76,471+0.44% | $76,617+0.19% | $76,872+0.52% | $76,849+0.49% | $76,994 10:28$75,950 9:39 | $76,355+0.28% | |
| Wed 16 Sept 2026 | FOMC | $75,577 | $75,739+0.21% | $75,587−0.20% | $75,759+0.03% | $75,652−0.12% | $75,886 11:47$75,360 10:13 | $76,139+0.74% |
| Tue 15 Sept 2026 | $78,185 | $76,949−1.58% | $76,572−0.49% | $76,298−0.85% | $76,458−0.64% | $76,912 9:30$75,560 10:51 | $75,577−3.34% | |
| Mon 14 Sept 2026 | $76,804 | $77,797+1.29% | $78,136+0.44% | $78,375+0.74% | $78,883+1.40% | $78,972 13:24$77,806 9:30 | $78,185+1.80% | |
| Fri 11 Sept 2026 | CPI | $76,529 | $77,544+1.33% | $79,214+2.15% | $79,024+1.91% | $77,823+0.36% | $79,837 10:03$77,234 9:37 | $77,212+0.89% |
| Thu 10 Sept 2026 | PPI | $78,282 | $76,940−1.71% | $77,146+0.27% | $77,242+0.39% | $77,285+0.45% | $77,393 10:56$76,735 9:32 | $76,529−2.24% |
| Wed 9 Sept 2026 | $78,449 | $79,590+1.45% | $79,117−0.59% | $79,247−0.43% | $78,838−0.95% | $79,660 9:34$78,032 11:24 | $78,282−0.21% | |
| Tue 8 Sept 2026 | $79,090 | $78,324−0.97% | $77,928−0.51% | $78,317−0.01% | $78,579+0.32% | $78,951 12:40$77,603 9:52 | $78,449−0.81% | |
| Fri 4 Sept 2026 | Jobs | $81,265 | $79,317−2.40% | $79,364+0.06% | $79,356+0.05% | $79,517+0.25% | $79,866 12:52$78,645 10:50 | $79,677−1.95% |
| Thu 3 Sept 2026 | $77,295 | $78,464+1.51% | $78,821+0.46% | $79,650+1.51% | $81,004+3.24% | $81,364 12:00$78,435 9:30 | $81,265+5.14% | |
| Wed 2 Sept 2026 | $77,397 | $76,897−0.65% | $77,107+0.27% | $77,288+0.51% | $77,057+0.21% | $77,534 12:27$76,574 9:38 | $77,302−0.12% | |
| Tue 1 Sept 2026 | $78,571 | $77,854−0.91% | $78,047+0.25% | $78,219+0.47% | $77,490−0.47% | $78,389 10:47$77,283 12:36 | $77,397−1.49% | |
| Mon 31 Aug 2026 | $77,659 | $78,022+0.47% | $77,834−0.24% | $77,997−0.03% | $78,524+0.64% | $78,842 12:56$77,711 9:52 | $78,571+1.17% | |
| Fri 28 Aug 2026 | $80,279 | $79,211−1.33% | $79,337+0.16% | $78,934−0.35% | $77,934−1.61% | $79,849 11:00$76,877 12:25 | $77,835−3.04% | |
| Thu 27 Aug 2026 | $79,023 | $79,384+0.46% | $79,537+0.19% | $79,904+0.66% | $80,724+1.69% | $80,820 13:19$78,920 9:48 | $80,279+1.59% | |
| Wed 26 Aug 2026 | $78,536 | $78,046−0.62% | $78,433+0.50% | $78,236+0.24% | $78,507+0.59% | $78,592 10:11$77,627 11:04 | $79,023+0.62% | |
| Tue 25 Aug 2026 | $78,985 | $78,632−0.45% | $78,6360.00% | $79,170+0.68% | $78,802+0.22% | $79,561 12:03$78,111 9:53 | $78,535−0.57% | |
| Mon 24 Aug 2026 | $77,724 | $78,975+1.61% | $78,571−0.51% | $79,356+0.48% | $78,538−0.55% | $79,989 11:32$77,860 9:46 | $78,986+1.62% | |
| Fri 21 Aug 2026 | $73,000 | $77,047+5.54% | $77,232+0.24% | $77,052+0.01% | $77,534+0.63% | $77,851 11:15$76,200 9:36 | $78,325+7.29% | |
| Thu 20 Aug 2026 | $69,298 | $71,842+3.67% | $71,627−0.30% | $71,395−0.62% | $72,788+1.32% | $72,850 12:59$71,083 9:37 | $73,008+5.35% | |
| Wed 19 Aug 2026 | $64,686 | $64,965+0.43% | $64,9660.00% | $65,378+0.64% | $67,984+4.65% | $69,749 11:28$64,762 9:41 | $69,298+7.13% | |
| Tue 18 Aug 2026 | $64,488 | $64,025−0.72% | $64,155+0.20% | $64,943+1.43% | $64,791+1.20% | $65,000 10:31$63,989 9:35 | $64,686+0.31% | |
CPI Consumer prices (CPI), 8:30 amJobs Jobs report, 8:30 amPPI Producer prices (PPI), 8:30 amFOMC Fed rate decision, 2:00 pm
Questions
Does Bitcoin move at the New York stock market open?
Yes. Since 2013, Bitcoin’s 1-minute moves have been 1.2× bigger in the first 15 minutes after 9:30 am New York time than in the half hour before, and volume 1.4× higher. At the same clock time on weekends, when the stock market is closed, the jump is only 1.0×.
Has the New York open become more important for Bitcoin?
Yes. In 2013–2016 the jump in 1-minute moves at 9:30 was 1.0×; since 2024, the year the US spot Bitcoin ETFs started trading, it is 2.0×. The table “Year by year” shows the change.
Does Bitcoin usually go up or down after the New York open?
Neither, on average. Over the first 4 hours (9:29 to 13:30 ET) the average move since 2013 is +0.04% and Bitcoin was up on 53% of days. What changes is the size of the moves, not their direction: the first 30 minutes move 0.49% on average, up or down.
When does Bitcoin make its morning high or low?
Most often in the first 30 minutes after the open: on 57% of days the high or the low of 9:30–13:30 ET came then, against about 23% if timing were random.
What time is the New York open in GMT?
The NYSE and Nasdaq open at 9:30 am New York time: 14:30 GMT in winter and 13:30 GMT while the US is on daylight saving time (from the second Sunday of March to the first Sunday of November).
Data: Bitstamp BTC/USD 1-minute and daily candles (the oldest exchange with minute-by-minute history, from 2013); the price at a given minute is the open of that minute’s candle. Event days: ourMacro Calendar (BLS release dates and Fed meetings, from 2019). NYSE holidays are left out. Halving cycles as on Bitcoin Cycle Indicators. Times are New York (ET). Updated with each publish of the site. Calculation: Cryptensive. Not financial advice.