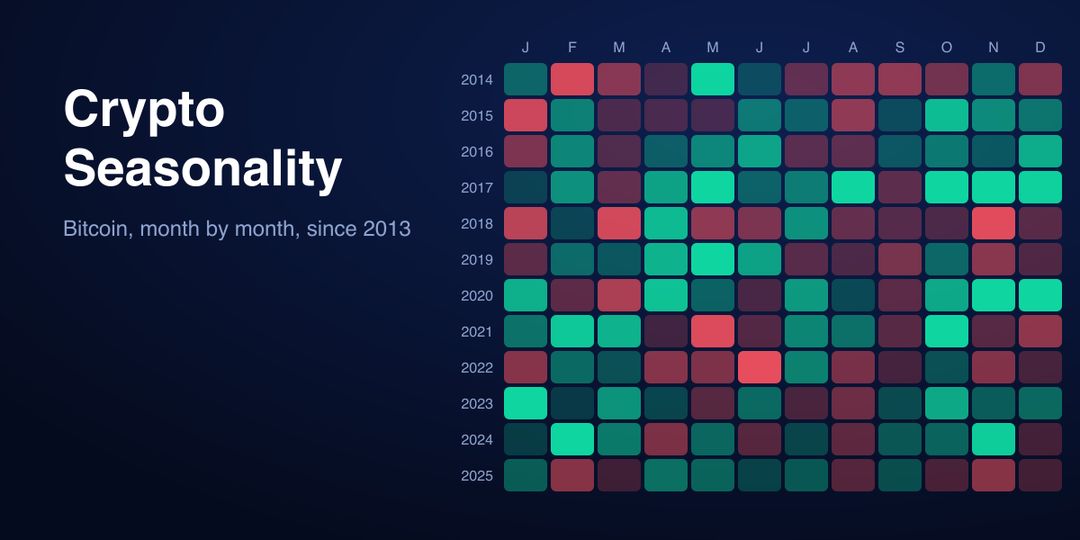
Crypto Seasonality
Is November usually green? Every monthly return of Bitcoin since 2013 and Ethereum since 2015, the best and worst months, weekdays and years of the four-year cycle, from daily closing prices.
Median November: +8.8% · average +41.8% · best +454% · worst −36.4%
2026 in the four-year cycleSecond year after — Bitcoin ended 0 of 3 such years up (median −64.3%).
Every month since 2013
Each cell is one month: the change from the last close of the month before to the last close of the month (UTC). Green rose, red fell; the stronger the colour, the bigger the move.
| Year | Jan | Feb | Mar | Apr | May | Jun | Jul | Aug | Sep | Oct | Nov | Dec | Year |
|---|---|---|---|---|---|---|---|---|---|---|---|---|---|
| 2026 | −10% | −15% | +1.8% | +12% | −3.6% | −20% | +7.3% | +25% | +6.4% | −7.3% | −2.2% | — | −13%* |
| 2025 | +9.6% | −18% | −2.2% | +14% | +11% | +2.4% | +8.0% | −6.5% | +5.4% | −3.9% | −17% | −3.2% | −6% |
| 2024 | +0.8% | +44% | +17% | −15% | +11% | −7.1% | +3.1% | −8.7% | +7.4% | +11% | +37% | −3.1% | +121% |
| 2023 | +40% | +0.0% | +23% | +2.8% | −7.0% | +12% | −4.1% | −11% | +4.0% | +29% | +8.8% | +12% | +155% |
| 2022 | −17% | +12% | +5.4% | −17% | −16% | −38% | +18% | −14% | −3.1% | +5.5% | −16% | −3.6% | −64% |
| 2021 | +14% | +36% | +31% | −2.0% | −35% | −6.1% | +19% | +13% | −7.2% | +40% | −7.0% | −19% | +60% |
| 2020 | +30% | −8.0% | −25% | +34% | +9.3% | −3.4% | +24% | +3.2% | −7.7% | +28% | +42% | +48% | +303% |
| 2019 | −7.6% | +11% | +6.5% | +30% | +60% | +26% | −6.8% | −4.5% | −14% | +11% | −18% | −5.0% | +92% |
| 2018 | −28% | +1.7% | −33% | +33% | −19% | −15% | +21% | −9.5% | −5.9% | −4.6% | −36% | −6.8% | −74% |
| 2017 | +0.7% | +22% | −9.2% | +26% | +70% | +8.5% | +16% | +64% | −7.8% | +49% | +58% | +38% | +1,369% |
| 2016 | −14% | +19% | −4.8% | +7.6% | +19% | +27% | −7.2% | −7.9% | +6.0% | +15% | +6.4% | +29% | +124% |
| 2015 | −32% | +17% | −3.9% | −3.3% | −2.5% | +14% | +8.2% | −19% | +2.6% | +33% | +20% | +14% | +34% |
| 2014 | +10% | −34% | −17% | −2.0% | +39% | +2.6% | −8.4% | −19% | −19% | −13% | +12% | −15% | −58% |
| 2013 | — | +58% | +189% | +50% | −7.2% | −25% | +9.8% | +28% | −1.7% | +53% | +454% | −33% | +5,485%* |
| Average | −0.3% | +10.5% | +12.7% | +12.2% | +9.2% | −1.6% | +7.7% | +2.3% | −2.5% | +17.5% | +41.8% | +4.0% | |
| Median | +0.7% | +11.9% | −0.2% | +9.7% | +3.4% | −0.5% | +8.1% | −7.2% | −2.4% | +12.9% | +8.8% | −3.2% | |
| Green | 54% | 71% | 50% | 64% | 50% | 50% | 71% | 36% | 43% | 71% | 62% | 38% |
* 2013 is counted from 1 Jan 2013, the first day of our data, so its first month is blank; 2026 is so far, and the outlined cell is November so far (not counted in the averages). The “Green” row is the share of years the month rose.
The typical month
- +1%Jan
- +12%Feb
- −0%Mar
- +10%Apr
- +3%May
- −1%Jun
- +8%Jul
- −7%Aug
- −2%Sep
- +13%Oct
- +9%Nov
- −3%Dec
- −0%Jan
- +10%Feb
- +13%Mar
- +12%Apr
- +9%May
- −2%Jun
- +8%Jul
- +2%Aug
- −2%Sep
- +18%Oct
- +42%Nov
- +4%Dec
- 54%Jan
- 71%Feb
- 50%Mar
- 64%Apr
- 50%May
- 50%Jun
- 71%Jul
- 36%Aug
- 43%Sep
- 71%Oct
- 62%Nov
- 38%Dec
The median is the middle year: half of the years did better, half worse. It is less pulled by a few giant months (like November 2013 or 2017) than the average. In “% green” the middle line is 50%.
Quarters
| Year | Q1 | Q2 | Q3 | Q4 |
|---|---|---|---|---|
| 2026 | −22% | −14% | +43% | −9% |
| 2025 | −12% | +30% | +6% | −23% |
| 2024 | +69% | −12% | +1% | +48% |
| 2023 | +72% | +7% | −12% | +57% |
| 2022 | −2% | −57% | −2% | −15% |
| 2021 | +103% | −41% | +25% | +6% |
| 2020 | −10% | +42% | +18% | +169% |
| 2019 | +10% | +163% | −23% | −13% |
| 2018 | −51% | −8% | +3% | −44% |
| 2017 | +11% | +131% | +75% | +226% |
| 2016 | −3% | +62% | −9% | +58% |
| 2015 | −24% | +8% | −10% | +82% |
| 2014 | −39% | +40% | −40% | −17% |
| 2013 | — | +4% | +38% | +467% |
| Median | −3% | +7% | +2% | +48% |
| Green | 38% | 64% | 57% | 62% |
Days of the week
Every day since 2013 (UTC close to close). “Typical move” is the average size of the day’s move, up or down: weekends are calmer because stock and bond markets are closed.
Months by year of the four-year cycle
Bitcoin’s price has moved in four-year cycles around each halving. Grouping the years by their place in the cycle shows a clearer pattern than the calendar alone. Median return of each month; 2026 is the highlighted row.
| Cycle year | Jan | Feb | Mar | Apr | May | Jun | Jul | Aug | Sep | Oct | Nov | Dec | Year |
|---|---|---|---|---|---|---|---|---|---|---|---|---|---|
| Halving year2016, 2020, 2024 | +1% | +19% | −5% | +8% | +11% | −3% | +3% | −8% | +6% | +15% | +37% | +29% | +124% |
| Year after the halving2013, 2017, 2021, 2025 | +10% | +29% | +14% | +20% | +2% | −2% | +13% | +20% | −4% | +45% | +26% | −11% | +60% |
| Second year after2014, 2018, 2022, 2026 | −14% | −7% | −7% | +5% | −10% | −17% | +13% | −12% | −4% | −6% | −16% | −7% | −64% |
| Year before the halving2015, 2019, 2023 | −8% | +11% | +7% | +3% | −3% | +14% | −4% | −11% | +3% | +29% | +9% | +12% | +92% |
Each cell is the median of only 2 to 4 years, so read it as a picture of past cycles, not a forecast.
Every year from 1 January
The change since the last close of the year before, day by day. The scale is logarithmic, so a fall of 50% and a rise of 100% look the same size.
Median November: −4.7% · average +4.3% · best +59.0% · worst −42.7%
2026 in the four-year cycleSecond year after — Ethereum ended 0 of 2 such years up (median −74.9%).
Every month since 2015
Each cell is one month: the change from the last close of the month before to the last close of the month (UTC). Green rose, red fell; the stronger the colour, the bigger the move.
| Year | Jan | Feb | Mar | Apr | May | Jun | Jul | Aug | Sep | Oct | Nov | Dec | Year |
|---|---|---|---|---|---|---|---|---|---|---|---|---|---|
| 2026 | −18% | −20% | +7.1% | +7.2% | −11% | −22% | +19% | +33% | +8.8% | −16% | −0.7% | — | −25%* |
| 2025 | −1.0% | −32% | −19% | −1.6% | +41% | −1.7% | +49% | +19% | −5.6% | −7.2% | −22% | −0.8% | −11% |
| 2024 | +0.0% | +46% | +9.2% | −17% | +25% | −8.7% | −5.9% | −22% | +3.6% | −3.4% | +47% | −10% | +46% |
| 2023 | +33% | +1.2% | +13% | +3.0% | −0.1% | +3.2% | −4.0% | −11% | +1.6% | +8.7% | +13% | +11% | +91% |
| 2022 | −27% | +8.6% | +12% | −17% | −29% | −45% | +58% | −7.6% | −15% | +18% | −18% | −7.6% | −68% |
| 2021 | +78% | +7.7% | +35% | +45% | −2.1% | −16% | +12% | +35% | −13% | +43% | +8.0% | −20% | +399% |
| 2020 | +39% | +22% | −39% | +55% | +11% | −2.0% | +53% | +26% | −17% | +7.4% | +59% | +20% | +469% |
| 2019 | −20% | +28% | +3.5% | +15% | +65% | +8.4% | −25% | −21% | +4.3% | +2.3% | −17% | −15% | −3% |
| 2018 | +48% | −24% | −54% | +69% | −14% | −21% | −4.7% | −35% | −18% | −15% | −43% | +18% | −82% |
| 2017 | +35% | +47% | +216% | +58% | +192% | +28% | −31% | +88% | −21% | +1.5% | +46% | +69% | +9,396% |
| 2016 | +147% | +175% | +80% | −23% | +60% | −11% | −4.7% | −1.7% | +13% | −17% | −22% | −7.2% | +754% |
| 2015 | — | — | — | — | — | — | — | — | −46% | +24% | −4.7% | +6.9% | −66%* |
| Average | +28.5% | +23.7% | +24.2% | +17.6% | +30.7% | −8.1% | +10.4% | +9.3% | −8.6% | +3.9% | +4.3% | +5.8% | |
| Median | +32.6% | +8.6% | +9.2% | +7.2% | +11.3% | −8.7% | −4.0% | −1.7% | −9.1% | +1.9% | −4.7% | −0.8% | |
| Green | 64% | 73% | 73% | 64% | 55% | 27% | 45% | 45% | 42% | 58% | 45% | 45% |
* 2015 is counted from 7 Aug 2015, the first day of our data, so its first month is blank; 2026 is so far, and the outlined cell is November so far (not counted in the averages). The “Green” row is the share of years the month rose.
The typical month
- +33%Jan
- +9%Feb
- +9%Mar
- +7%Apr
- +11%May
- −9%Jun
- −4%Jul
- −2%Aug
- −9%Sep
- +2%Oct
- −5%Nov
- −1%Dec
- +29%Jan
- +24%Feb
- +24%Mar
- +18%Apr
- +31%May
- −8%Jun
- +10%Jul
- +9%Aug
- −9%Sep
- +4%Oct
- +4%Nov
- +6%Dec
- 64%Jan
- 73%Feb
- 73%Mar
- 64%Apr
- 55%May
- 27%Jun
- 45%Jul
- 45%Aug
- 42%Sep
- 58%Oct
- 45%Nov
- 45%Dec
The median is the middle year: half of the years did better, half worse. It is less pulled by a few giant months (like November 2013 or 2017) than the average. In “% green” the middle line is 50%.
Quarters
| Year | Q1 | Q2 | Q3 | Q4 |
|---|---|---|---|---|
| 2026 | −29% | −25% | +71% | −17% |
| 2025 | −45% | +36% | +67% | −28% |
| 2024 | +60% | −6% | −24% | +28% |
| 2023 | +52% | +6% | −14% | +37% |
| 2022 | −11% | −67% | +24% | −10% |
| 2021 | +160% | +19% | +32% | +23% |
| 2020 | +3% | +69% | +59% | +105% |
| 2019 | +6% | +105% | −38% | −28% |
| 2018 | −48% | +15% | −49% | −43% |
| 2017 | +528% | +489% | +2% | +151% |
| 2016 | +1,122% | +9% | +6% | −40% |
| 2015 | — | — | — | +26% |
| Median | +6% | +15% | +6% | +23% |
| Green | 64% | 73% | 64% | 55% |
Days of the week
Every day since 2015 (UTC close to close). “Typical move” is the average size of the day’s move, up or down: weekends are calmer because stock and bond markets are closed.
Months by year of the four-year cycle
Bitcoin’s price has moved in four-year cycles around each halving. Grouping the years by their place in the cycle shows a clearer pattern than the calendar alone. Median return of each month; 2026 is the highlighted row.
| Cycle year | Jan | Feb | Mar | Apr | May | Jun | Jul | Aug | Sep | Oct | Nov | Dec | Year |
|---|---|---|---|---|---|---|---|---|---|---|---|---|---|
| Halving year2016, 2020, 2024 | +39% | +46% | +9% | −17% | +25% | −9% | −5% | −2% | +4% | −3% | +47% | −7% | +469% |
| Year after the halving2013, 2017, 2021, 2025 | +35% | +8% | +35% | +45% | +41% | −2% | +12% | +35% | −13% | +1% | +8% | −1% | +399% |
| Second year after2014, 2018, 2022, 2026 | −18% | −20% | +7% | +7% | −14% | −22% | +19% | −8% | −15% | −15% | −30% | +5% | −75% |
| Year before the halving2015, 2019, 2023 | +6% | +14% | +8% | +9% | +33% | +6% | −14% | −16% | +2% | +9% | −5% | +7% | +44% |
Each cell is the median of only 2 to 4 years, so read it as a picture of past cycles, not a forecast. Ethereum has no halving; the cycle years are Bitcoin’s, as Ether has mostly followed it.
Every year from 1 January
The change since the last close of the year before, day by day. The scale is logarithmic, so a fall of 50% and a rise of 100% look the same size.
How to read it
- Look at the median and the share of green years together. A month with a high average but only half its years green was lifted by one or two huge years.
- Each month has about 13 past examples for Bitcoin and 11 for Ethereum. That is a small sample: one more year can change the picture.
- The four-year cycle matters more than the calendar. October in a bear year looks very different from October in the year after a halving.
Related
See where Bitcoin is in its cycle on Bitcoin Cycle Indicators, how the market feels on the Fear & Greed Index, and how Bitcoin reacts to the Fed on FOMC & Crypto.
Trading a pattern because “it worked before” is a classic trap: read about investor psychology.
Questions
Is November a good month for Bitcoin?
Since 2013, Bitcoin rose in November in 8 of 13 years. The median November return is +8.8% and the average +41.8% (best +454%, worst −36.4%). So far this month: −2.2%.
What is the best month for Bitcoin?
By median return since 2013, October (+12.9%, green in 10 of 14 years). The weakest is August (−7.2%, green in 5 of 14 years).
Which day of the week is best for Bitcoin?
The differences between weekdays are small. Since 2013 the highest average daily return was on Monday (+0.64%) and the lowest on Thursday (+0.05%). Weekends move less: Saturday’s average move is +1.70% against +2.76% on Monday.
Does seasonality predict the price?
No. Each month has only about 13 past examples, and one huge year (like 2013 or 2017) can lift an average on its own. Seasonality shows what usually happened, which is useful context, but news, the economy and the four-year cycle matter more.
Data: CoinMarketCap daily closing prices (UTC), Bitcoin from 1 Jan 2013, Ethereum from 7 Aug 2015; updated with each publish of the site (last price 7 Nov 2026). Calculation: Cryptensive. Not financial advice.