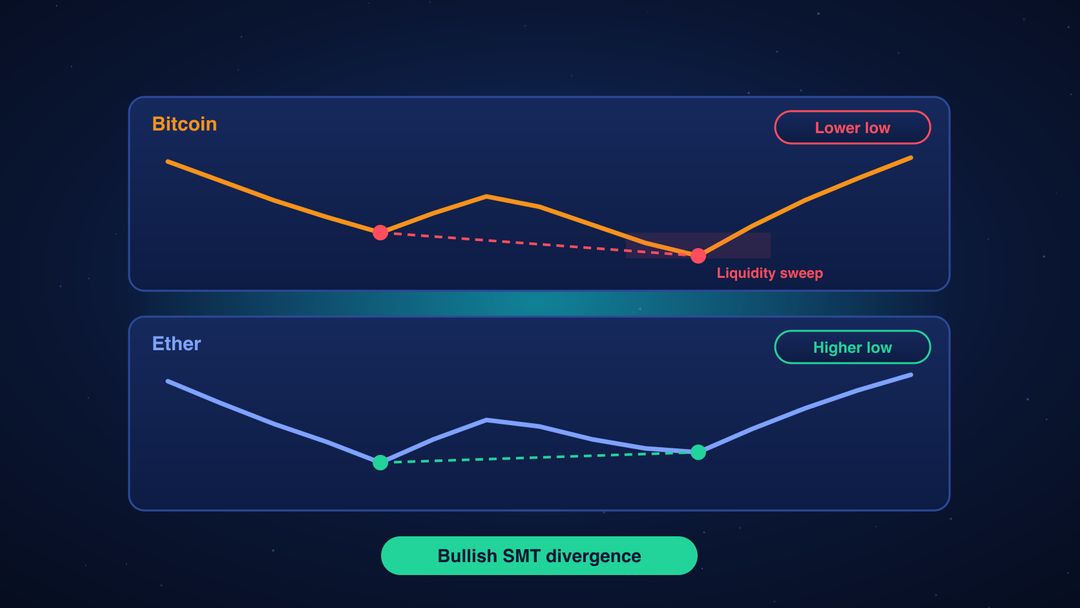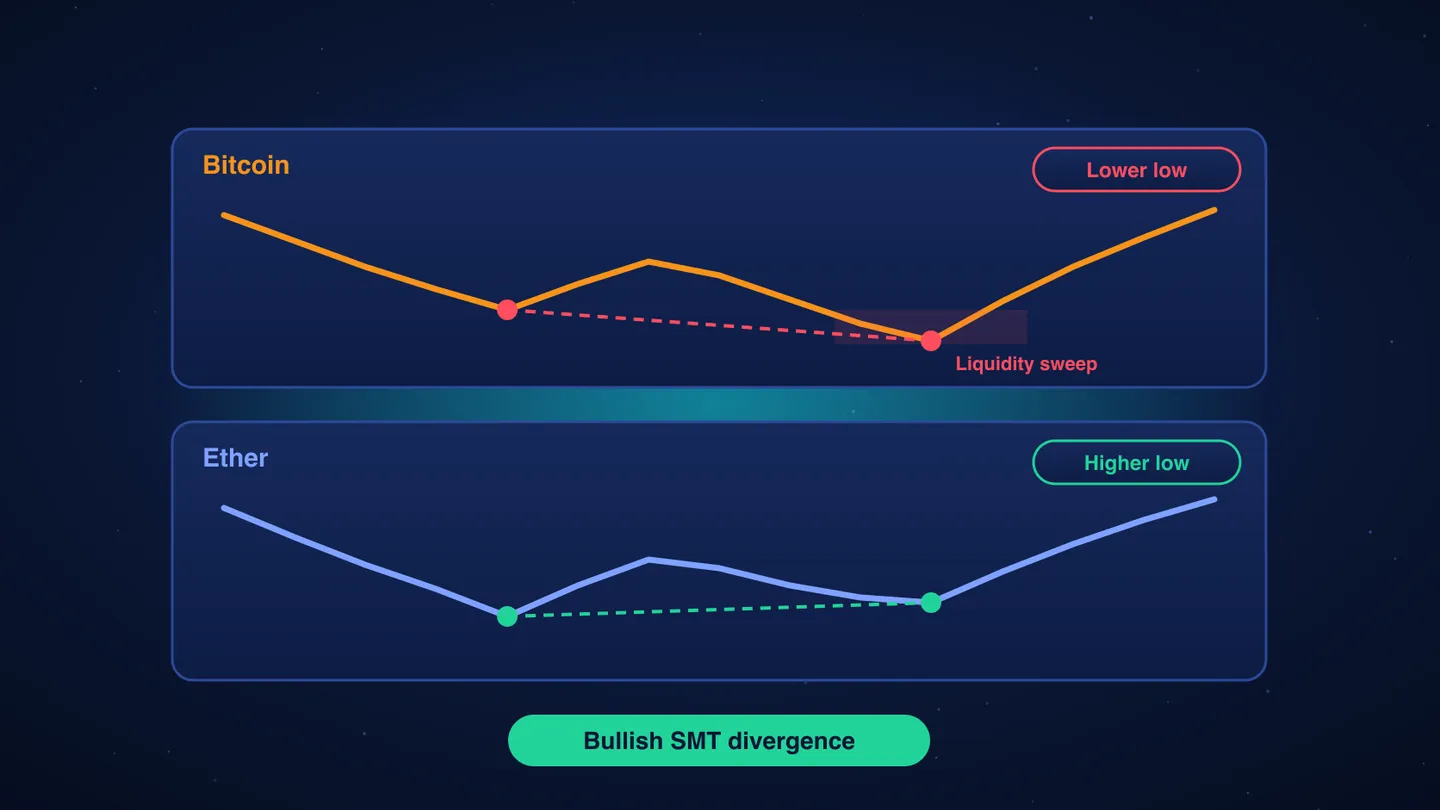
Bitcoin drops to a new low and takes out everyone’s stop-losses. But at the same moment, Ether refuses to follow: it holds above its previous low. A few days later, both rally.
Traders call that disagreement SMT divergence, short for Smart Money Technique. It is one of the most popular ideas in modern trading education, and crypto, where Bitcoin and Ether usually move together, is a natural place to use it.
This guide explains SMT from scratch, shows real examples from the Bitcoin and Ether charts, covers how experienced traders actually use it, and shares the results of our own test of the signal. Beginners can stop after the examples; advanced readers will find the second half more useful.
Part 1: The basics
Where the name comes from
SMT was popularized by trader and educator Michael J. Huddleston, known online as ICT (The Inner Circle Trader). It is part of a broader approach often called Smart Money Concepts, built on one idea: large players (banks, funds, market makers, whales) need a lot of liquidity to fill their orders, and they find it where smaller traders cluster their orders.
“Smart money” is a trading term, not a proven fact about who is behind each move. But the concept gives you a useful way to read charts.
Highs, lows and the liquidity around them
Every chart has swing highs (peaks) and swing lows (troughs). Many traders put their stop-losses just beyond them: below the last low if they are long, above the last high if they are short. Breakout traders also place buy orders above highs and sell orders below lows.
So just beyond every obvious high and low sits a pile of orders. When price pushes through such a level, those orders get triggered. Traders call this a liquidity sweep or stop hunt. Sometimes the move keeps going (a real breakout). Often, it reverses as soon as the orders are filled.
SMT is a way to tell the two apart.
The idea behind SMT
Bitcoin and Ether are correlated: most of the time, when one makes a new low, so does the other. When they disagree at a key turning point, it is a clue that one of them only swept liquidity, and that the move may not be real.
There are two types:
- Bullish SMT divergence (near lows): one asset makes a lower low, the other makes a higher low. The selling pressure is not confirmed. Possible reversal up.
- Bearish SMT divergence (near highs): one asset makes a higher high, the other makes a lower high. The buying pressure is not confirmed. Possible reversal down.
It doesn’t matter which of the two assets makes the new extreme. What matters is that they don’t agree.
Real examples from the charts
All examples use daily highs and lows of BTC-USD and ETH-USD on Coinbase. A swing high or low here is the highest or lowest price within seven days on each side.
Example 1: bullish SMT at the 2026 low (June–July 2026)
| First low | Second low | Verdict | |
|---|---|---|---|
| Bitcoin | $59,073 (June 5) | $57,718 (July 1) | Lower low |
| Ether | $1,505 | $1,545 | Higher low |
Bitcoin broke below its June low, triggering the stops beneath it, but Ether held above its own. That is a textbook bullish SMT. Two weeks after the July 1 low, Bitcoin was 7.9% higher, and the July low turned out to be the bottom of the year so far.
Example 2: bearish SMT at a record high (January 2025)
| First high | Second high | Verdict | |
|---|---|---|---|
| Bitcoin | $102,736 (Jan 7) | $109,358 (Jan 20) | Higher high |
| Ether | $3,746 | $3,527 | Lower high |
On January 20, 2025, Bitcoin set a new all-time high. Ether stayed well below its early-January peak. The rally was not confirmed, and a month later Bitcoin was about 5% lower, the start of a correction that lasted until Bitcoin touched about $74,400 on April 7, 2025.
Example 3: a tiny divergence before a big drop (April–May 2026)
| First high | Second high | Verdict | |
|---|---|---|---|
| Bitcoin | $79,523 (Apr 22) | $82,814 (May 6) | Higher high |
| Ether | $2,428 | $2,424 | Lower high (by just $4) |
Here Ether missed its previous high by almost nothing. Some traders would call this a divergence, others would ignore it. Bitcoin then fell 25% over the next 30 days. A reminder that SMT is partly in the eye of the beholder.
Example 4: a divergence that failed (January–February 2025)
| First low | Second low | Verdict | |
|---|---|---|---|
| Bitcoin | $89,029 (Jan 13) | $91,178 (Feb 3) | Higher low |
| Ether | $2,914 | $2,150 | Lower low |
A clean bullish SMT: Bitcoin held up while Ether crashed. But the market kept falling, and a month later Bitcoin was 10.7% lower. Divergences fail, and when they do, the stop-loss is what saves you.
Which pairs to compare in crypto
SMT only works between assets that normally move together:
- Bitcoin vs Ether: the classic crypto pair.
- Bitcoin vs the total crypto market cap: shows whether the rest of the market confirms Bitcoin’s move.
- Ether vs Solana, or other large coins in the same sector.
- Bitcoin vs US stock indices (Nasdaq, S&P 500): useful during US trading hours, but the correlation comes and goes.
- Inverse pairs: Bitcoin vs the US dollar index (DXY). Because they usually move in opposite directions, you compare Bitcoin’s low with the dollar’s high.
Always compare the same kind of data: the same exchange, the same quote currency and the same timeframe.
Part 2: How advanced traders use SMT
SMT is a filter, not a signal
Experienced traders rarely trade a divergence on its own. A typical sequence looks like this:
- Higher-timeframe bias. Decide the direction from the daily or 4-hour chart: are you looking for longs or shorts?
- A liquidity sweep. Price takes out an obvious high or low (a previous day’s low, an equal low, a round number).
- SMT divergence. The correlated asset fails to make the same new extreme.
- A market structure shift (MSS). On a lower timeframe, price breaks the last swing in the other direction, showing that the reversal has started. This is also called a change of character (CHoCH).
- Entry on a pullback, often into a fair value gap (a fast move that left a gap between candles) or an order block (the last candle before the strong move).
- Stop-loss beyond the swept extreme, and targets at the next pool of liquidity on the other side.
If any step is missing, the trade is skipped.
Timeframes and timing
- Higher timeframes (daily, weekly) give fewer but more meaningful divergences.
- Lower timeframes (5 to 15 minutes) give many signals, most of them noise. They are used to time entries after a higher-timeframe setup.
- Crypto trades 24/7, but most volume still arrives when traditional markets open. Many SMT traders focus on ICT’s two “kill zones”: the London open (2–5 am New York time) and the New York open (7–10 am New York time). In winter, that is 07:00–10:00 GMT and 12:00–15:00 GMT (see our guide to market opening hours).
What breaks SMT
- Correlation regimes change. In a long period when Ether underperforms Bitcoin, “bearish” divergences appear all the time because Ether keeps lagging. The signal becomes background noise.
- Wicks vs closes. Some traders use wicks, others use candle closes. The same chart can show a divergence on one and not on the other.
- Different exchanges. Highs and lows differ slightly from one exchange to another. A $4 divergence (as in Example 3) can appear on one exchange and not on another.
- News. An ETF decision, a hack or a Fed surprise can overwhelm any chart pattern. Our Leverage & Liquidations dashboard shows when the market is crowded enough for stop runs to snowball.
Our test: does SMT work on its own?
We scanned Bitcoin and Ether’s daily chart from mid-2024 to November 2026 for every SMT divergence between consecutive swing points. We found 15 complete signals (8 bullish, 7 bearish).
Then we measured what Bitcoin did over the next 14 days, starting from the day the signal could actually be seen. That detail matters: a swing low is only confirmed after the market has moved away from it, seven days later in our definition. Measuring from the low itself would be cheating, because nobody knows it is the low at the time.
The result:
- 7 of the 15 signals were right after 14 days (4 of 8 bullish, 3 of 7 bearish).
- For comparison, Bitcoin rose over any random 14-day window 51% of the time.
In other words, a mechanical SMT signal on the daily chart, used alone, was no better than a coin flip. The examples above look convincing in hindsight; the full list does not.
That doesn’t mean SMT is useless. It means it works the way experienced traders use it: as one piece of confluence, together with a liquidity sweep, a structure shift and strict risk management, not as a buy or sell button.
Rules to remember
- Two correlated assets, one key level. SMT only counts at a meaningful high or low, not in the middle of a range.
- Wait for confirmation. A divergence is a warning, not an entry. Let price shift structure first.
- Always use a stop-loss beyond the swept high or low. Example 4 shows why.
- Be honest about hindsight. Divergences are easy to see on past charts and much harder in real time.
- Keep a journal. Record every SMT setup you see, taken or not, and check the results after a few months.
The takeaway
SMT divergence is a simple, visual idea: when two markets that usually agree suddenly don’t, at the exact moment one of them sweeps a high or a low, the move may be a trap. For beginners, it is a great way to learn how liquidity and stop-losses shape price. For advanced traders, it is a useful filter inside a complete plan. Just don’t expect it to work on its own: our data says it doesn’t.
This article is for education only and is not financial advice. Prices are daily highs and lows of BTC-USD and ETH-USD on Coinbase.
Frequently asked questions
What is SMT divergence?
SMT, short for Smart Money Technique, is when two assets that usually move together disagree at a key high or low. For example, Bitcoin makes a lower low while Ether makes a higher low.
Who created SMT divergence?
It was popularized by trader and educator Michael J. Huddleston, known online as ICT (The Inner Circle Trader). It is part of a broader approach called Smart Money Concepts.
What is the difference between bullish and bearish SMT?
Bullish SMT appears near lows: one asset makes a lower low, the other a higher low. Bearish SMT appears near highs: one makes a higher high, the other a lower high.
Does SMT divergence work?
Not on its own. In our test of Bitcoin and Ether's daily chart, 7 of 15 signals were right after 14 days, no better than a coin flip. Experienced traders use it as a filter.
What is a liquidity sweep?
It is when price pushes through an obvious high or low and triggers the orders sitting just beyond it. Sometimes the move keeps going, and often it reverses once the orders are filled.
Which crypto pairs work for SMT?
It only works between assets that normally move together. Bitcoin vs Ether is the classic pair. Others are Bitcoin vs total crypto market cap, Ether vs Solana, and Bitcoin vs the dollar index.